Chrysler 2014 Annual Report Download - page 257
Download and view the complete annual report
Please find page 257 of the 2014 Chrysler annual report below. You can navigate through the pages in the report by either clicking on the pages listed below, or by using the keyword search tool below to find specific information within the annual report.-
 1
1 -
2
-
3
-
4
-
5
-
6
-
7
-
8
-
9
-
10
-
11
-
12
-
13
-
14
-
15
-
16
-
17
-
18
-
19
-
20
-
21
-
22
-
23
-
24
-
25
-
26
-
27
-
28
-
29
-
30
-
31
-
32
-
33
-
34
-
35
-
36
-
37
-
38
-
39
-
40
-
41
-
42
-
43
-
44
-
45
-
46
-
47
-
48
-
49
-
50
-
51
-
52
-
53
-
54
-
55
-
56
-
57
-
58
-
59
-
60
-
61
-
62
-
63
-
64
-
65
-
66
-
67
-
68
-
69
-
70
-
71
-
72
-
73
-
74
-
75
-
76
-
77
-
78
-
79
-
80
-
81
-
82
-
83
-
84
-
85
-
86
-
87
-
88
-
89
-
90
-
91
-
92
-
93
-
94
-
95
-
96
-
97
-
98
-
99
-
100
-
101
-
102
-
103
-
104
-
105
-
106
-
107
-
108
-
109
-
110
-
111
-
112
-
113
-
114
-
115
-
116
-
117
-
118
-
119
-
120
-
121
-
122
-
123
-
124
-
125
-
126
-
127
-
128
-
129
-
130
-
131
-
132
-
133
-
134
-
135
-
136
-
137
-
138
-
139
-
140
-
141
-
142
-
143
-
144
-
145
-
146
-
147
-
148
-
149
-
150
-
151
-
152
-
153
-
154
-
155
-
156
-
157
-
158
-
159
-
160
-
161
-
162
-
163
-
164
-
165
-
166
-
167
-
168
-
169
-
170
-
171
-
172
-
173
-
174
-
175
-
176
-
177
-
178
-
179
-
180
-
181
-
182
-
183
-
184
-
185
-
186
-
187
-
188
-
189
-
190
-
191
-
192
-
193
-
194
-
195
-
196
-
197
-
198
-
199
-
200
-
201
-
202
-
203
-
204
-
205
-
206
-
207
-
208
-
209
-
210
-
211
-
212
-
213
-
214
-
215
-
216
-
217
-
218
-
219
-
220
-
221
-
222
-
223
-
224
-
225
-
226
-
227
-
228
-
229
-
230
-
231
-
232
-
233
-
234
-
235
-
236
-
237
-
238
-
239
-
240
-
241
-
242
-
243
-
244
-
245
-
246
-
 247
247 -
 248
248 -
 249
249 -
 250
250 -
 251
251 -
 252
252 -
 253
253 -
 254
254 -
 255
255 -
 256
256 -
 257
257 -
 258
258 -
 259
259 -
 260
260 -
 261
261 -
 262
262 -
 263
263 -
 264
264 -
 265
265 -
 266
266 -
 267
267 -
268
-
269
-
270
-
271
-
272
-
273
-
274
-
275
-
276
-
277
-
278
-
279
-
280
-
281
-
282
-
283
-
284
-
285
-
286
-
287
-
288
-
289
-
290
-
291
-
292
-
293
-
294
-
295
-
296
-
297
-
298
-
299
-
300
-
301
-
302
-
303
 |
 |

2014 | ANNUAL REPORT 255
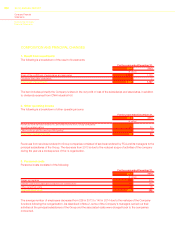
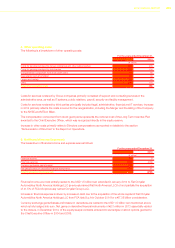
In assessing the potential impact of changes in interest rates, the Group segregates fixed rate financial instruments
(for which the impact is assessed in terms of fair value) from floating rate financial instruments (for which the impact is
assessed in terms of cash flows).
The fixed rate financial instruments used by the Group consist principally of part of the portfolio of the financial services
companies (basically customer financing and financial leases) and part of debt (including subsidized loans and bonds).
The potential loss in fair value of fixed rate financial instruments (including the effect of interest rate derivative financial
instruments) held at December 31, 2014, resulting from a hypothetical 10.0 percent change in market interest rates,
would have been approximately €100 million (approximately €110 million at December 31, 2013).
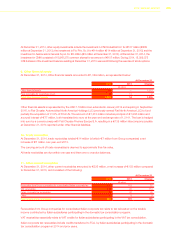
Floating rate financial instruments consist principally of cash and cash equivalents, loans provided by the financial
services companies to the sales network and part of debt. The effect of the sale of receivables is also considered in
the sensitivity analysis as well as the effect of hedging derivative instruments.
A hypothetical 10.0 percent change in short-term interest rates at December 31, 2014, applied to floating rate financial
assets and liabilities, operations for the sale of receivables and derivative financial instruments, would have resulted
in increased net financial expenses before taxes, on an annual basis, of approximately €12 million (€13 million at
December 31, 2013).
This analysis is based on the assumption that there is a general and instantaneous change of 10.0 percent in interest
rates across homogeneous categories. A homogeneous category is defined on the basis of the currency in which
the financial assets and liabilities are denominated. In addition, the sensitivity analysis applied to floating rate financial
instruments assumes that cash and cash equivalents and other short-term financial assets and liabilities which expire
during the projected 12 month period will be renewed or reinvested in similar instruments, bearing the hypothetical
short-term interest rates.
Quantitative information on commodity price risk
The Group has entered into derivative contracts for certain commodities to hedge its exposure to commodity price risk
associated with buying raw materials and energy used in its normal operations.
In connection with the commodity price derivative contracts outstanding at December 31, 2014, a hypothetical
10.0 percent change in the price of the commodities at that date would have caused a fair value loss of €50 million
(€45 million at December 31, 2013). Future trade flows whose hedging transactions have been analyzed were not
considered in this analysis. It is reasonable to assume that changes in commodity prices will produce the opposite
effect, of an equal or greater amount, on the underlying transactions that have been hedged.
36. Subsequent events
The Group has evaluated subsequent events through March 5, 2015, which is the date the financial statements were
authorized for issuance. There were no subsequent events.