Chrysler 2014 Annual Report Download - page 75
Download and view the complete annual report
Please find page 75 of the 2014 Chrysler annual report below. You can navigate through the pages in the report by either clicking on the pages listed below, or by using the keyword search tool below to find specific information within the annual report.-
 1
1 -
2
-
3
-
4
-
5
-
6
-
7
-
8
-
9
-
10
-
11
-
12
-
13
-
14
-
15
-
16
-
17
-
18
-
19
-
20
-
21
-
22
-
23
-
24
-
25
-
26
-
27
-
28
-
29
-
30
-
31
-
32
-
33
-
34
-
35
-
36
-
37
-
38
-
39
-
40
-
41
-
42
-
43
-
44
-
45
-
46
-
47
-
48
-
49
-
50
-
51
-
52
-
53
-
54
-
55
-
56
-
57
-
58
-
59
-
60
-
61
-
62
-
63
-
64
-
 65
65 -
 66
66 -
 67
67 -
 68
68 -
 69
69 -
 70
70 -
 71
71 -
 72
72 -
 73
73 -
 74
74 -
 75
75 -
 76
76 -
 77
77 -
 78
78 -
 79
79 -
 80
80 -
 81
81 -
 82
82 -
 83
83 -
 84
84 -
 85
85 -
86
-
87
-
88
-
89
-
90
-
91
-
92
-
93
-
94
-
95
-
96
-
97
-
98
-
99
-
100
-
101
-
102
-
103
-
104
-
105
-
106
-
107
-
108
-
109
-
110
-
111
-
112
-
113
-
114
-
115
-
116
-
117
-
118
-
119
-
120
-
121
-
122
-
123
-
124
-
125
-
126
-
127
-
128
-
129
-
130
-
131
-
132
-
133
-
134
-
135
-
136
-
137
-
138
-
139
-
140
-
141
-
142
-
143
-
144
-
145
-
146
-
147
-
148
-
149
-
150
-
151
-
152
-
153
-
154
-
155
-
156
-
157
-
158
-
159
-
160
-
161
-
162
-
163
-
164
-
165
-
166
-
167
-
168
-
169
-
170
-
171
-
172
-
173
-
174
-
175
-
176
-
177
-
178
-
179
-
180
-
181
-
182
-
183
-
184
-
185
-
186
-
187
-
188
-
189
-
190
-
191
-
192
-
193
-
194
-
195
-
196
-
197
-
198
-
199
-
200
-
201
-
202
-
203
-
204
-
205
-
206
-
207
-
208
-
209
-
210
-
211
-
212
-
213
-
214
-
215
-
216
-
217
-
218
-
219
-
220
-
221
-
222
-
223
-
224
-
225
-
226
-
227
-
228
-
229
-
230
-
231
-
232
-
233
-
234
-
235
-
236
-
237
-
238
-
239
-
240
-
241
-
242
-
243
-
244
-
245
-
246
-
247
-
248
-
249
-
250
-
251
-
252
-
253
-
254
-
255
-
256
-
257
-
258
-
259
-
260
-
261
-
262
-
263
-
264
-
265
-
266
-
267
-
268
-
269
-
270
-
271
-
272
-
273
-
274
-
275
-
276
-
277
-
278
-
279
-
280
-
281
-
282
-
283
-
284
-
285
-
286
-
287
-
288
-
289
-
290
-
291
-
292
-
293
-
294
-
295
-
296
-
297
-
298
-
299
-
300
-
301
-
302
-
303
 |
 |
2014 | ANNUAL REPORT 73
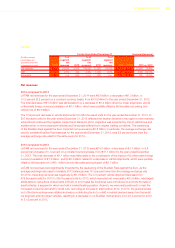
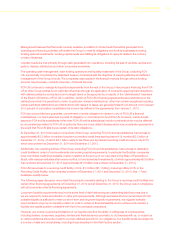
EMEA
For the Years Ended December 31, Increase/(decrease)
(€ million, except percentages
and shipments which are
in thousands of units) 2014
% of
segment
net
revenues 2013
% of
segment
net
revenues 2012
% of
segment
net
revenues 2014 vs. 2013 2013 vs. 2012
Net revenues 18,020 100.0% 17,335 100.0% 17,717 100.0% 685 4.0% (382) (2.2)%
EBIT (109) (0.6)% (506) (2.9)% (725) (4.1)% 397 78.5% 219 30.2%
Shipments 1,024 n.m 979 n.m. 1,012 n.m. 45 4.6% (33) (3.3)%
Net revenues
2014 compared to 2013
EMEA net revenues for the year ended December 31, 2014 were €18.0 billion, an increase of €0.7 billion, or 4.0
percent, from €17.3 billion for the year ended December 31, 2013.
The €0.7 billion increase in EMEA net revenues was mainly attributable to the combination of (i) a €0.6 billion increase
in vehicle shipments, (ii) a €0.3 billion favorable sales mix impact primarily driven by Jeep brand and LCV shipments,
partially offset by (iii) unfavorable pricing of €0.1 billion due to the increasingly competitive trading environment
particularly related to passenger cars in Europe and (iv) €0.1 billion lower components sales.
In particular, the 4.6 percent increase in vehicle shipments, from 979 thousand units for the year ended December 31,
2013, to 1,024 thousand units for the year ended December 31, 2014, was largely driven by the Fiat 500 family, the
Jeep brand (the all-new Renegade and Cherokee) and the new Fiat Ducato.
2013 compared to 2012
EMEA net revenues for the year ended December 31, 2013 were €17.3 billion, a decrease of €0.4 billion,
or 2.2 percent (1.4 percent on a constant currency basis), from €17.7 billion for the year ended December 31, 2012.
The total decrease of €0.4 billion was attributable to the combined effects of (i) a decrease in vehicle shipments of
€0.4 billion, (ii) unfavorable vehicle pricing of €0.2 billion, (iii) a decrease in service parts, accessories and service
contracts and other revenues of €0.1 billion and (iv) the impact of unfavorable foreign currency translation of
€0.1 billion mainly due to fluctuations of the U.S. Dollar and the British Pound Sterling which were partially offset by
(v) the effects of a change in scope of consolidation, arising from obtaining control of VM Motori S.p.A. in 2013, a
diesel engine manufacturing company which impacted net revenues positively by €0.2 billion and (vi) positive vehicle
mix of €0.1 billion.
The 3.3 percent decrease in vehicle shipments, from 1,012 thousand units in 2012 to 979 thousand units in 2013,
impacted net revenues by €0.4 billion. The decrease in vehicle shipments was in part due to the persistent weak
economic conditions in Europe (EU27 + EFTA), which resulted in a 1.8 percent passenger car industry contraction,
and in part due to a decrease in our passenger car market share from 6.3 percent in 2012 to 6.0 percent in 2013,
while LCV market share decreased from 11.7 percent for 2012 to 11.6 percent for 2013, as a result of the increasing
competition in the industry. These conditions led to a decrease in service parts, accessories and service contracts and
other revenues of €0.1 billion, while the highly competitive environment and resulting price pressure impacted pricing
unfavorably by €0.2 billion. In July 2013, the Group’s option to acquire the remaining 50.0 percent stake in VM Motori
S.p.A. became exercisable, which resulted in consolidation on a line-by-line basis. This resulted in a positive impact
to net revenues of €0.2 billion. The shift in sales mix towards newly launched and content enriched vehicles, for which
sales prices were adjusted, such as the Fiat 500L and the new Fiat Panda over other vehicles, such as the existing Fiat
Panda resulted in a positive vehicle mix impact of €0.1 billion.