Chrysler 2014 Annual Report Download - page 183
Download and view the complete annual report
Please find page 183 of the 2014 Chrysler annual report below. You can navigate through the pages in the report by either clicking on the pages listed below, or by using the keyword search tool below to find specific information within the annual report.-
 1
1 -
2
-
3
-
4
-
5
-
6
-
7
-
8
-
9
-
10
-
11
-
12
-
13
-
14
-
15
-
16
-
17
-
18
-
19
-
20
-
21
-
22
-
23
-
24
-
25
-
26
-
27
-
28
-
29
-
30
-
31
-
32
-
33
-
34
-
35
-
36
-
37
-
38
-
39
-
40
-
41
-
42
-
43
-
44
-
45
-
46
-
47
-
48
-
49
-
50
-
51
-
52
-
53
-
54
-
55
-
56
-
57
-
58
-
59
-
60
-
61
-
62
-
63
-
64
-
65
-
66
-
67
-
68
-
69
-
70
-
71
-
72
-
73
-
74
-
75
-
76
-
77
-
78
-
79
-
80
-
81
-
82
-
83
-
84
-
85
-
86
-
87
-
88
-
89
-
90
-
91
-
92
-
93
-
94
-
95
-
96
-
97
-
98
-
99
-
100
-
101
-
102
-
103
-
104
-
105
-
106
-
107
-
108
-
109
-
110
-
111
-
112
-
113
-
114
-
115
-
116
-
117
-
118
-
119
-
120
-
121
-
122
-
123
-
124
-
125
-
126
-
127
-
128
-
129
-
130
-
131
-
132
-
133
-
134
-
135
-
136
-
137
-
138
-
139
-
140
-
141
-
142
-
143
-
144
-
145
-
146
-
147
-
148
-
149
-
150
-
151
-
152
-
153
-
154
-
155
-
156
-
157
-
158
-
159
-
160
-
161
-
162
-
163
-
164
-
165
-
166
-
167
-
168
-
169
-
170
-
171
-
172
-
 173
173 -
 174
174 -
 175
175 -
 176
176 -
 177
177 -
 178
178 -
 179
179 -
 180
180 -
 181
181 -
 182
182 -
 183
183 -
 184
184 -
 185
185 -
 186
186 -
 187
187 -
 188
188 -
 189
189 -
 190
190 -
 191
191 -
 192
192 -
 193
193 -
194
-
195
-
196
-
197
-
198
-
199
-
200
-
201
-
202
-
203
-
204
-
205
-
206
-
207
-
208
-
209
-
210
-
211
-
212
-
213
-
214
-
215
-
216
-
217
-
218
-
219
-
220
-
221
-
222
-
223
-
224
-
225
-
226
-
227
-
228
-
229
-
230
-
231
-
232
-
233
-
234
-
235
-
236
-
237
-
238
-
239
-
240
-
241
-
242
-
243
-
244
-
245
-
246
-
247
-
248
-
249
-
250
-
251
-
252
-
253
-
254
-
255
-
256
-
257
-
258
-
259
-
260
-
261
-
262
-
263
-
264
-
265
-
266
-
267
-
268
-
269
-
270
-
271
-
272
-
273
-
274
-
275
-
276
-
277
-
278
-
279
-
280
-
281
-
282
-
283
-
284
-
285
-
286
-
287
-
288
-
289
-
290
-
291
-
292
-
293
-
294
-
295
-
296
-
297
-
298
-
299
-
300
-
301
-
302
-
303
 |
 |
2014 | ANNUAL REPORT 181
2. Cost of sales
Cost of sales in 2014, 2013 and 2012 amounted to €83,146 million, €74,326 million and €71,473 million,
respectively, comprised mainly of expenses incurred in the manufacturing and distribution of vehicles and parts, of
which, cost of materials and components are the most significant. The remaining costs principally include labor costs,
consisting of direct and indirect wages, as well as depreciation of Property, plant and equipment and amortization of
Other intangible assets relating to production and transportation costs.
Cost of sales also includes warranty and product-related costs, estimated at the time of sale to dealer networks
or to the end customer. Depending on the specific nature of the recall, including the significance and magnitude,
certain warranty expenses incurred are reported as Other unusual expenses. The Group believes that this separate
identification allows the users of the Consolidated financial statements to better analyze the comparative year-on-year
financial performance of the Group.
Cost of sales in 2014, 2013 and 2012 also includes €170 million, €190 million and €158 million, respectively, of
interest and other financial expenses from financial services companies.
3. Selling, general and administrative costs
Selling costs in 2014, 2013 and 2012 amounted to €4,565 million, €4,269 million and €4,367 million, respectively,
and mainly consisted of marketing, advertising, and sales personnel costs. Marketing and advertising expenses
consisted primarily of media campaigns, as well as marketing support in the form of trade and auto shows, events,
and sponsorship.
General and administrative costs in 2014, 2013 and 2012 amounted to €2,519 million, €2,433 million and
€2,408 million, respectively, and mainly consisted of administration expenses which are not attributable to sales,
manufacturing or research and development functions.
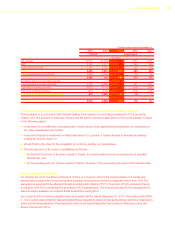
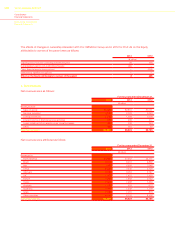
4. Research and development costs
Research and development costs were as follows:
For the years ended December 31,
2014 2013 2012
(€ million)
Research and development costs expensed during the year 1,398 1,325 1,180
Amortization of capitalized development costs 1,057 887 621
Write-off of costs previously capitalized 82 24 57
Total Research and development costs 2,537 2,236 1,858
Refer to Note 14 in the Consolidated financial statements for information on capitalized development costs.
5. Result from investments
The net gain in 2014, 2013 and 2012, amounting to €131 million, €84 million and €87 million, respectively, mainly
consisted of the Group’s share in the Net profit/(loss) of equity method investments for €117 million, €74 million and
€74 million, respectively and other income and expenses arising from investments measured at cost.