Chrysler 2014 Annual Report Download - page 137
Download and view the complete annual report
Please find page 137 of the 2014 Chrysler annual report below. You can navigate through the pages in the report by either clicking on the pages listed below, or by using the keyword search tool below to find specific information within the annual report.-
 1
1 -
2
-
3
-
4
-
5
-
6
-
7
-
8
-
9
-
10
-
11
-
12
-
13
-
14
-
15
-
16
-
17
-
18
-
19
-
20
-
21
-
22
-
23
-
24
-
25
-
26
-
27
-
28
-
29
-
30
-
31
-
32
-
33
-
34
-
35
-
36
-
37
-
38
-
39
-
40
-
41
-
42
-
43
-
44
-
45
-
46
-
47
-
48
-
49
-
50
-
51
-
52
-
53
-
54
-
55
-
56
-
57
-
58
-
59
-
60
-
61
-
62
-
63
-
64
-
65
-
66
-
67
-
68
-
69
-
70
-
71
-
72
-
73
-
74
-
75
-
76
-
77
-
78
-
79
-
80
-
81
-
82
-
83
-
84
-
85
-
86
-
87
-
88
-
89
-
90
-
91
-
92
-
93
-
94
-
95
-
96
-
97
-
98
-
99
-
100
-
101
-
102
-
103
-
104
-
105
-
106
-
107
-
108
-
109
-
110
-
111
-
112
-
113
-
114
-
115
-
116
-
117
-
118
-
119
-
120
-
121
-
122
-
123
-
124
-
125
-
126
-
 127
127 -
 128
128 -
 129
129 -
 130
130 -
 131
131 -
 132
132 -
 133
133 -
 134
134 -
 135
135 -
 136
136 -
 137
137 -
 138
138 -
 139
139 -
 140
140 -
 141
141 -
 142
142 -
 143
143 -
 144
144 -
 145
145 -
 146
146 -
 147
147 -
148
-
149
-
150
-
151
-
152
-
153
-
154
-
155
-
156
-
157
-
158
-
159
-
160
-
161
-
162
-
163
-
164
-
165
-
166
-
167
-
168
-
169
-
170
-
171
-
172
-
173
-
174
-
175
-
176
-
177
-
178
-
179
-
180
-
181
-
182
-
183
-
184
-
185
-
186
-
187
-
188
-
189
-
190
-
191
-
192
-
193
-
194
-
195
-
196
-
197
-
198
-
199
-
200
-
201
-
202
-
203
-
204
-
205
-
206
-
207
-
208
-
209
-
210
-
211
-
212
-
213
-
214
-
215
-
216
-
217
-
218
-
219
-
220
-
221
-
222
-
223
-
224
-
225
-
226
-
227
-
228
-
229
-
230
-
231
-
232
-
233
-
234
-
235
-
236
-
237
-
238
-
239
-
240
-
241
-
242
-
243
-
244
-
245
-
246
-
247
-
248
-
249
-
250
-
251
-
252
-
253
-
254
-
255
-
256
-
257
-
258
-
259
-
260
-
261
-
262
-
263
-
264
-
265
-
266
-
267
-
268
-
269
-
270
-
271
-
272
-
273
-
274
-
275
-
276
-
277
-
278
-
279
-
280
-
281
-
282
-
283
-
284
-
285
-
286
-
287
-
288
-
289
-
290
-
291
-
292
-
293
-
294
-
295
-
296
-
297
-
298
-
299
-
300
-
301
-
302
-
303
 |
 |

2014 | ANNUAL REPORT 135
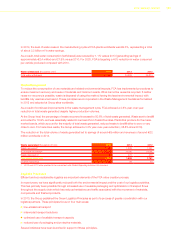
The Company establishes target compensation levels using a market-based approach and periodically benchmarks
its executive compensation program against peer companies and monitors compensation levels and trends in the
market.
For the CEO, the competitive benchmark included both a US and European peer group. The US peer companies
included General Motors, Ford, General Electric, Hewlett-Packard, IBM, Boeing, Procter & Gamble, Johnson &
Johnson, PepsiCo, United Technologies, Dow Chemical, Caterpillar, ConocoPhillips, Pfizer, Lockheed Martin,
Johnson Controls, Honeywell, Deere, General Dynamics, 3M, Northrop, Grumman, Raytheon, Xerox, Goodyear,
Whirlpool. The non US peer companies included Volkswagen, Daimler, BMW Group, Siemens, Nestlé, BASF,
ArcelorMittal, Airbus, Peugeot, Unilever, Novartis, Saint-Gobain, Renault, Bayer, ThyssenKrupp, Rio Tinto, Roche,
Continental, Lyondell Basell, Sanofi, and Volvo.
For the Chairman, the same peer group companies were used excluding those companies who do not have an
Executive Chairman only role. Most US companies in the peer group do not have a separate Executive Chairman role;
whereas, most European companies in the peer group do.
Remuneration of Executive Directors
Introduction
The level and structure of the remuneration of the Executive Directors will be determined by the Company’s Board
of Directors at the recommendation of the Compensation Committee within the scope of the Policy and taking into
account the scenario analyses made. It will furthermore be based on compensation levels offered in the market in
general and for the sector.
The Company periodically benchmarks its executive compensation program and the compensation offered to
executive directors against peer companies and monitors compensation levels and trends in the market.
Remuneration elements
On such basis, the compensation of executive directors consists, inter alia, of the following elements:
Fixed component
The primary objective of the base salary (the fixed part of the annual cash compensation) for executive directors is
to attract and retain well qualified senior executives. The Company’s policy is to periodically benchmark comparable
salaries paid to other executives with similar experience in its compensation peer group.
Variable components
The Company’s Chairman is not eligible to receive variable compensation while the CEO is eligible to receive variable
compensation, subject to the achievement of pre-established financial and other designated performance targets.
The variable components of the CEO’s remuneration, both the short and the long-term components, are linked to
predetermined, assessable targets.
Annually, scenario analyses are carried out with respect to the possible outcomes of the variable remuneration
components and how they may affect the remuneration of the executive directors. Such analysis was also carried out
for the financial year 2014.
Short-Term Incentives
The primary objective of performance based short-term variable cash based incentives is to focus on the business
priorities for the current or next year. The CEO’s short-term variable incentive is based on achieving short-term
(annual) financial and other designated objectives proposed by the Compensation Committee and approved by the
non-executive directors each year.