Chrysler 2014 Annual Report Download - page 59
Download and view the complete annual report
Please find page 59 of the 2014 Chrysler annual report below. You can navigate through the pages in the report by either clicking on the pages listed below, or by using the keyword search tool below to find specific information within the annual report.-
 1
1 -
2
-
3
-
4
-
5
-
6
-
7
-
8
-
9
-
10
-
11
-
12
-
13
-
14
-
15
-
16
-
17
-
18
-
19
-
20
-
21
-
22
-
23
-
24
-
25
-
26
-
27
-
28
-
29
-
30
-
31
-
32
-
33
-
34
-
35
-
36
-
37
-
38
-
39
-
40
-
41
-
42
-
43
-
44
-
45
-
46
-
47
-
48
-
 49
49 -
 50
50 -
 51
51 -
 52
52 -
 53
53 -
 54
54 -
 55
55 -
 56
56 -
 57
57 -
 58
58 -
 59
59 -
 60
60 -
 61
61 -
 62
62 -
 63
63 -
 64
64 -
 65
65 -
 66
66 -
 67
67 -
 68
68 -
 69
69 -
70
-
71
-
72
-
73
-
74
-
75
-
76
-
77
-
78
-
79
-
80
-
81
-
82
-
83
-
84
-
85
-
86
-
87
-
88
-
89
-
90
-
91
-
92
-
93
-
94
-
95
-
96
-
97
-
98
-
99
-
100
-
101
-
102
-
103
-
104
-
105
-
106
-
107
-
108
-
109
-
110
-
111
-
112
-
113
-
114
-
115
-
116
-
117
-
118
-
119
-
120
-
121
-
122
-
123
-
124
-
125
-
126
-
127
-
128
-
129
-
130
-
131
-
132
-
133
-
134
-
135
-
136
-
137
-
138
-
139
-
140
-
141
-
142
-
143
-
144
-
145
-
146
-
147
-
148
-
149
-
150
-
151
-
152
-
153
-
154
-
155
-
156
-
157
-
158
-
159
-
160
-
161
-
162
-
163
-
164
-
165
-
166
-
167
-
168
-
169
-
170
-
171
-
172
-
173
-
174
-
175
-
176
-
177
-
178
-
179
-
180
-
181
-
182
-
183
-
184
-
185
-
186
-
187
-
188
-
189
-
190
-
191
-
192
-
193
-
194
-
195
-
196
-
197
-
198
-
199
-
200
-
201
-
202
-
203
-
204
-
205
-
206
-
207
-
208
-
209
-
210
-
211
-
212
-
213
-
214
-
215
-
216
-
217
-
218
-
219
-
220
-
221
-
222
-
223
-
224
-
225
-
226
-
227
-
228
-
229
-
230
-
231
-
232
-
233
-
234
-
235
-
236
-
237
-
238
-
239
-
240
-
241
-
242
-
243
-
244
-
245
-
246
-
247
-
248
-
249
-
250
-
251
-
252
-
253
-
254
-
255
-
256
-
257
-
258
-
259
-
260
-
261
-
262
-
263
-
264
-
265
-
266
-
267
-
268
-
269
-
270
-
271
-
272
-
273
-
274
-
275
-
276
-
277
-
278
-
279
-
280
-
281
-
282
-
283
-
284
-
285
-
286
-
287
-
288
-
289
-
290
-
291
-
292
-
293
-
294
-
295
-
296
-
297
-
298
-
299
-
300
-
301
-
302
-
303
 |
 |

2014 | ANNUAL REPORT 57
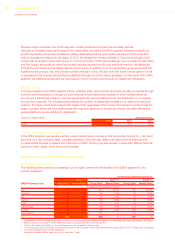
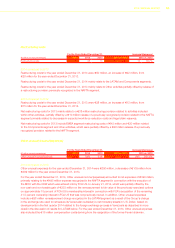
2013 compared to 2012
Net revenues for the year ended December 31, 2013 were €86.6 billion, an increase of €2.8 billion, or 3.4 percent
(7.4 percent on a constant currency basis), from €83.8 billion for the year ended December 31, 2012.
The increase in net revenues was primarily attributable to increases of €2.3 billion in NAFTA segment net revenues
and €1.5 billion in APAC segment net revenues, both of which were largely driven by increases in shipments. In
addition, Maserati net revenues increased by €0.9 billion supported by an increase in shipments driven by the 2013
launches including the new Quattroporte in March and the Ghibli in October. These increases were partly offset by a
decrease of €1.1 billion in LATAM segment net revenues, and a €0.4 billion decrease in EMEA segment net revenues.
The decrease in LATAM segment net revenues was largely attributable to the combined effect of unfavorable foreign
currency translation related to the weakening of the Brazilian Real against the Euro, and a 3.0 percent decrease
in vehicle shipments. The decrease in EMEA segment net revenues was largely due to a decrease in shipments,
attributable to the combined effect of the persistent weak economic conditions in Europe, which resulted in a
1.8 percent passenger car industry contraction, and in part due to a decrease in our passenger car market share,
as a result of increasing competition in the industry.
See — Segments below for a detailed discussion of net revenues by segment.
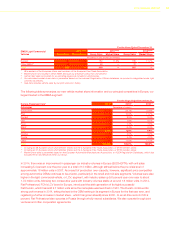
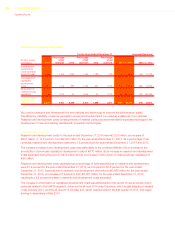
Cost of sales
For the Years Ended December 31, Increase/(decrease)
(€ million, except
percentages) 2014
Percentage
of net
revenues 2013
Percentage
of net
revenues 2012
Percentage
of net
revenues 2014 vs. 2013 2013 vs. 2012
Cost of sales 83,146 86.5% 74,326 85.8% 71,473 85.3% 8,820 11.9% 2,853 4.0%
Cost of sales includes purchases, certain warranty and product-related costs, labor costs, depreciation, amortization
and logistic costs. We purchase a variety of components (including mechanical, steel, electrical and electronic, plastic
components as well as castings and tires), raw materials (steel, rubber, aluminum, resin, copper, lead, and precious
metals including platinum, palladium and rhodium), supplies, utilities, logistics and other services from numerous
suppliers which we use to manufacture our vehicles, parts and accessories. These purchases generally account for
approximately 80 percent of total cost of sales. Fluctuations in cost of sales are primarily related to the number of our
vehicles we produce and ship, along with changes in vehicle mix, as newer models of vehicles generally have more
technologically advanced components and enhancements and therefore additional costs per unit. The cost of sales
could also be affected, to a lesser extent, by fluctuations in certain raw material prices.