Chrysler 2014 Annual Report Download - page 205
Download and view the complete annual report
Please find page 205 of the 2014 Chrysler annual report below. You can navigate through the pages in the report by either clicking on the pages listed below, or by using the keyword search tool below to find specific information within the annual report.-
 1
1 -
2
-
3
-
4
-
5
-
6
-
7
-
8
-
9
-
10
-
11
-
12
-
13
-
14
-
15
-
16
-
17
-
18
-
19
-
20
-
21
-
22
-
23
-
24
-
25
-
26
-
27
-
28
-
29
-
30
-
31
-
32
-
33
-
34
-
35
-
36
-
37
-
38
-
39
-
40
-
41
-
42
-
43
-
44
-
45
-
46
-
47
-
48
-
49
-
50
-
51
-
52
-
53
-
54
-
55
-
56
-
57
-
58
-
59
-
60
-
61
-
62
-
63
-
64
-
65
-
66
-
67
-
68
-
69
-
70
-
71
-
72
-
73
-
74
-
75
-
76
-
77
-
78
-
79
-
80
-
81
-
82
-
83
-
84
-
85
-
86
-
87
-
88
-
89
-
90
-
91
-
92
-
93
-
94
-
95
-
96
-
97
-
98
-
99
-
100
-
101
-
102
-
103
-
104
-
105
-
106
-
107
-
108
-
109
-
110
-
111
-
112
-
113
-
114
-
115
-
116
-
117
-
118
-
119
-
120
-
121
-
122
-
123
-
124
-
125
-
126
-
127
-
128
-
129
-
130
-
131
-
132
-
133
-
134
-
135
-
136
-
137
-
138
-
139
-
140
-
141
-
142
-
143
-
144
-
145
-
146
-
147
-
148
-
149
-
150
-
151
-
152
-
153
-
154
-
155
-
156
-
157
-
158
-
159
-
160
-
161
-
162
-
163
-
164
-
165
-
166
-
167
-
168
-
169
-
170
-
171
-
172
-
173
-
174
-
175
-
176
-
177
-
178
-
179
-
180
-
181
-
182
-
183
-
184
-
185
-
186
-
187
-
188
-
189
-
190
-
191
-
192
-
193
-
194
-
 195
195 -
 196
196 -
 197
197 -
 198
198 -
 199
199 -
 200
200 -
 201
201 -
 202
202 -
 203
203 -
 204
204 -
 205
205 -
 206
206 -
 207
207 -
 208
208 -
 209
209 -
 210
210 -
 211
211 -
 212
212 -
 213
213 -
 214
214 -
 215
215 -
216
-
217
-
218
-
219
-
220
-
221
-
222
-
223
-
224
-
225
-
226
-
227
-
228
-
229
-
230
-
231
-
232
-
233
-
234
-
235
-
236
-
237
-
238
-
239
-
240
-
241
-
242
-
243
-
244
-
245
-
246
-
247
-
248
-
249
-
250
-
251
-
252
-
253
-
254
-
255
-
256
-
257
-
258
-
259
-
260
-
261
-
262
-
263
-
264
-
265
-
266
-
267
-
268
-
269
-
270
-
271
-
272
-
273
-
274
-
275
-
276
-
277
-
278
-
279
-
280
-
281
-
282
-
283
-
284
-
285
-
286
-
287
-
288
-
289
-
290
-
291
-
292
-
293
-
294
-
295
-
296
-
297
-
298
-
299
-
300
-
301
-
302
-
303
 |
 |
2014 | ANNUAL REPORT 203
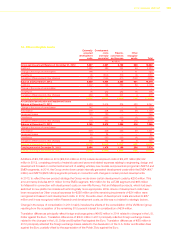
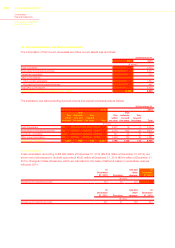
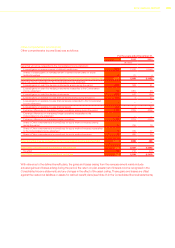
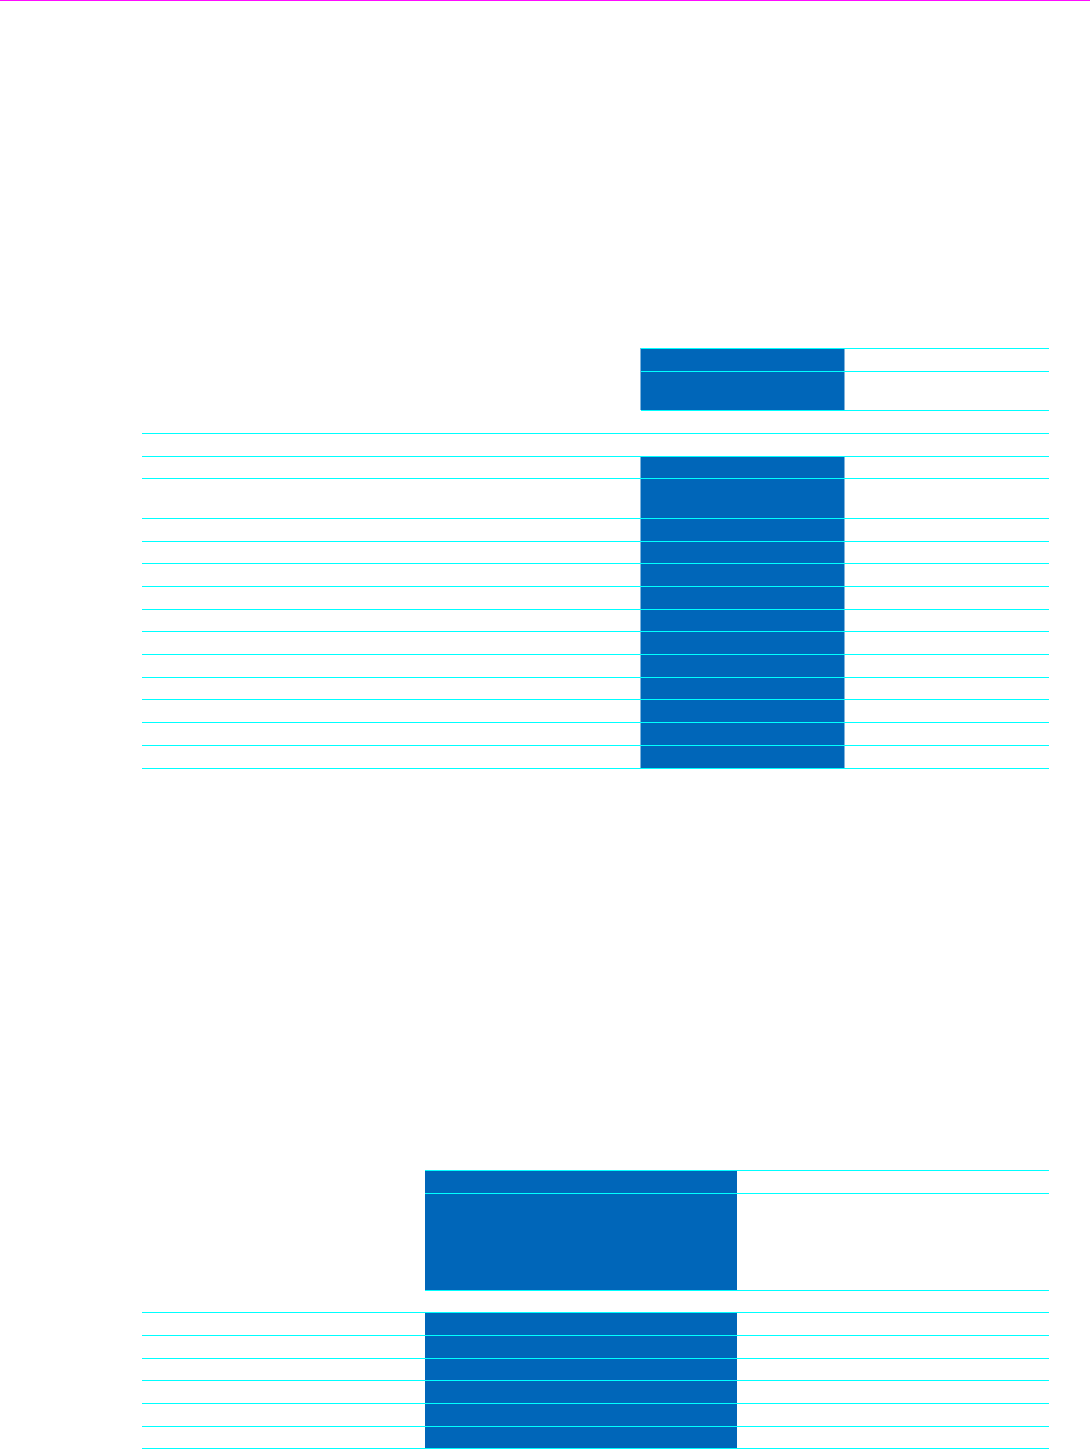
20. Other financial assets and Other financial liabilities
These line items mainly consist of fair value measurement of derivative financial instruments. They also include some
collateral deposits (held in connection with derivative transactions and debts).
At December 31,
2014 2013
Positive
fair value
Negative
fair value
Positive
fair value
Negative
fair value
(€ million)
Fair value hedges:
Interest rate risk - interest rate swaps 82 — 93 —
Interest rate and exchange rate risk - combined interest rate
and currency swaps — (41) 15 —
Total Fair value hedges 82 (41) 108 —
Cash flow hedge:
Currency risks - forward contracts, currency swaps and currency options 222 (467) 260 (59)
Interest rate risk - interest rate swaps 1 (4) 1 (3)
Interest rate and currency risk - combined interest rate and currency swaps 60 (7) 9 (22)
Commodity price risk – commodity swaps and commodity options 4 (16) 6 (5)
Total Cash flow hedges 287 (494) 276 (89)
Derivatives for trading 108 (213) 129 (48)
Fair value of derivative instruments 477 (748) 513 (137)
Collateral deposits 38 — 20 —
Other financial assets/(liabilities) 515 (748) 533 (137)
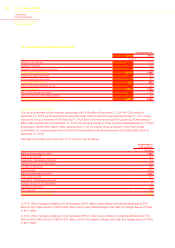
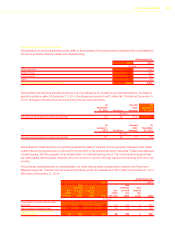
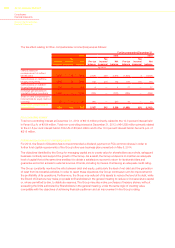
The overall change in Other financial assets (from €533 million at December 31, 2013 to €515 million at
December 31, 2014) and in Other financial liabilities (from €137 million at December 31, 2013 to €748 million at
December 31, 2014) was mostly due to fluctuations in exchange rates, interest rates, commodity prices during the
year and the settlement of the instruments which matured during the year.
As Other financial assets and liabilities primarily consist of hedging derivatives, the change in their value is
compensated by the change in the value of the hedged items.
At December 31, 2014 and 2013, Derivatives for trading primarily consisted of derivative contracts entered for hedging
purposes which do not qualify for hedge accounting and one embedded derivative in a bond issue in which the yield is
determined as a function of trends in the inflation rate and related hedging derivative, which converts the exposure to
floating rate (the total value of the embedded derivative is offset by the value of the hedging derivative).
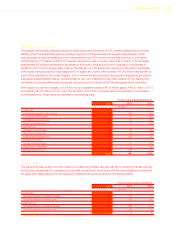
The following table provides an analysis by due date of outstanding derivative financial instruments based on their
notional amounts:
At December 31,
2014 2013
Due
within
one year
Due
between
one and
five
years
Due
beyond
five
years Total
Due
within
one year
Due
between
one and
five
years
Due
beyond
five
years Total
(€ million)
Currency risk management 15,328 2,544 — 17,872 10,446 802 — 11,248
Interest rate risk management 172 1,656 — 1,828 764 1,782 — 2,546
Interest rate and currency risk management 698 1,513 — 2,211 — 1,455 — 1,455
Commodity price risk management 483 59 — 542 450 23 — 473
Other derivative financial instruments — — 14 14 — — 14 14
Total notional amount 16,681 5,772 14 22,467 11,660 4,062 14 15,736