Chrysler 2014 Annual Report Download - page 193
Download and view the complete annual report
Please find page 193 of the 2014 Chrysler annual report below. You can navigate through the pages in the report by either clicking on the pages listed below, or by using the keyword search tool below to find specific information within the annual report.-
 1
1 -
2
-
3
-
4
-
5
-
6
-
7
-
8
-
9
-
10
-
11
-
12
-
13
-
14
-
15
-
16
-
17
-
18
-
19
-
20
-
21
-
22
-
23
-
24
-
25
-
26
-
27
-
28
-
29
-
30
-
31
-
32
-
33
-
34
-
35
-
36
-
37
-
38
-
39
-
40
-
41
-
42
-
43
-
44
-
45
-
46
-
47
-
48
-
49
-
50
-
51
-
52
-
53
-
54
-
55
-
56
-
57
-
58
-
59
-
60
-
61
-
62
-
63
-
64
-
65
-
66
-
67
-
68
-
69
-
70
-
71
-
72
-
73
-
74
-
75
-
76
-
77
-
78
-
79
-
80
-
81
-
82
-
83
-
84
-
85
-
86
-
87
-
88
-
89
-
90
-
91
-
92
-
93
-
94
-
95
-
96
-
97
-
98
-
99
-
100
-
101
-
102
-
103
-
104
-
105
-
106
-
107
-
108
-
109
-
110
-
111
-
112
-
113
-
114
-
115
-
116
-
117
-
118
-
119
-
120
-
121
-
122
-
123
-
124
-
125
-
126
-
127
-
128
-
129
-
130
-
131
-
132
-
133
-
134
-
135
-
136
-
137
-
138
-
139
-
140
-
141
-
142
-
143
-
144
-
145
-
146
-
147
-
148
-
149
-
150
-
151
-
152
-
153
-
154
-
155
-
156
-
157
-
158
-
159
-
160
-
161
-
162
-
163
-
164
-
165
-
166
-
167
-
168
-
169
-
170
-
171
-
172
-
173
-
174
-
175
-
176
-
177
-
178
-
179
-
180
-
181
-
182
-
 183
183 -
 184
184 -
 185
185 -
 186
186 -
 187
187 -
 188
188 -
 189
189 -
 190
190 -
 191
191 -
 192
192 -
 193
193 -
 194
194 -
 195
195 -
 196
196 -
 197
197 -
 198
198 -
 199
199 -
 200
200 -
 201
201 -
 202
202 -
 203
203 -
204
-
205
-
206
-
207
-
208
-
209
-
210
-
211
-
212
-
213
-
214
-
215
-
216
-
217
-
218
-
219
-
220
-
221
-
222
-
223
-
224
-
225
-
226
-
227
-
228
-
229
-
230
-
231
-
232
-
233
-
234
-
235
-
236
-
237
-
238
-
239
-
240
-
241
-
242
-
243
-
244
-
245
-
246
-
247
-
248
-
249
-
250
-
251
-
252
-
253
-
254
-
255
-
256
-
257
-
258
-
259
-
260
-
261
-
262
-
263
-
264
-
265
-
266
-
267
-
268
-
269
-
270
-
271
-
272
-
273
-
274
-
275
-
276
-
277
-
278
-
279
-
280
-
281
-
282
-
283
-
284
-
285
-
286
-
287
-
288
-
289
-
290
-
291
-
292
-
293
-
294
-
295
-
296
-
297
-
298
-
299
-
300
-
301
-
302
-
303
 |
 |

2014 | ANNUAL REPORT 191
Goodwill
At December 31, 2014, goodwill includes €10,185 million for FCA US (€8,967 million at December 31, 2013) and
€786 million for Ferrari S.p.A (€786 million at December 31, 2013) which resulted from their respective acquisitions.
Goodwill is allocated to operating segments or to CGUs within the operating segments as appropriate, in accordance
with IAS 36 – Impairment of assets.
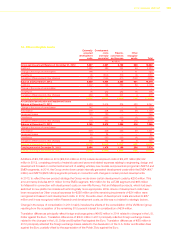
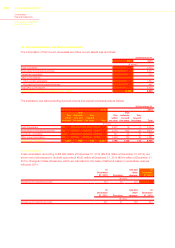
The following table presents the allocation of Goodwill across the segments:
At December 31,
2014 2013
(€ million)
NAFTA 8,350 7,330
APAC 1,085 968
LATAM 517 461
EMEA 233 208
Ferrari 786 786
Components 52 51
Other activities 36 36
Total Goodwill (net carrying amount) 11,059 9,840
In accordance with IAS 36, Goodwill is not amortized and is tested for impairment annually, or more frequently, if facts
or circumstances indicate that the asset may be impaired. Impairment testing is performed by comparing the carrying
amount and the recoverable amount of each CGU to which Goodwill has been allocated. The recoverable amount of a
CGU is the higher of its fair value less costs to sell and its value in use.
The assumptions used in this process represent management’s best estimate for the period under consideration.
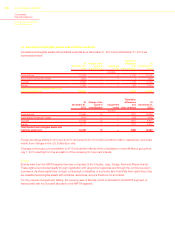
Goodwill allocated to the NAFTA segment represents 75.5 percent of the Group’s total Goodwill, which also includes
the carrying amount of the Group’s Brands, as discussed above. The estimate of the value in use of the NAFTA
segment for purposes of performing the annual impairment test was based on the following assumptions:
The expected future cash flows covering the period from 2015 through 2018 have been derived from the Group
Business Plan presented on May 6, 2014. More specifically, in making the estimates, expected EBITDA for the
periods under consideration was adjusted to reflect the expected capital expenditure and monetary contributions to
pension plans and other post-employment benefit plans. These cash flows relate to the CGU in its condition when
preparing the financial statements and exclude the estimated cash flows that might arise from restructuring plans or
other structural changes. Volumes and sales mix used for estimating the future cash flow are based on assumptions
that are considered reasonable and sustainable and represent the best estimate of expected conditions regarding
market trends and segment, brand and model share for the NAFTA segment over the period considered.
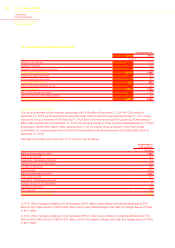
The expected future cash flows include a normalized terminal period used to estimate the future results beyond
the time period explicitly considered. This terminal period was calculated by applying an EBITDA margin of the
average of the expected EBITDA for 2015-2018 to the average 2015-2018 expected revenues used in calculating
the expected EBITDA. The terminal period was then adjusted by a normalized amount of investments determined
assuming a steady state business and by expected monetary contributions to pension plans and post-employment
benefit plans.