Chrysler 2014 Annual Report Download - page 14
Download and view the complete annual report
Please find page 14 of the 2014 Chrysler annual report below. You can navigate through the pages in the report by either clicking on the pages listed below, or by using the keyword search tool below to find specific information within the annual report.-
 1
1 -
2
-
3
-
 4
4 -
 5
5 -
 6
6 -
 7
7 -
 8
8 -
 9
9 -
 10
10 -
 11
11 -
 12
12 -
 13
13 -
 14
14 -
 15
15 -
 16
16 -
 17
17 -
 18
18 -
 19
19 -
 20
20 -
 21
21 -
 22
22 -
 23
23 -
 24
24 -
25
-
26
-
27
-
28
-
29
-
30
-
31
-
32
-
33
-
34
-
35
-
36
-
37
-
38
-
39
-
40
-
41
-
42
-
43
-
44
-
45
-
46
-
47
-
48
-
49
-
50
-
51
-
52
-
53
-
54
-
55
-
56
-
57
-
58
-
59
-
60
-
61
-
62
-
63
-
64
-
65
-
66
-
67
-
68
-
69
-
70
-
71
-
72
-
73
-
74
-
75
-
76
-
77
-
78
-
79
-
80
-
81
-
82
-
83
-
84
-
85
-
86
-
87
-
88
-
89
-
90
-
91
-
92
-
93
-
94
-
95
-
96
-
97
-
98
-
99
-
100
-
101
-
102
-
103
-
104
-
105
-
106
-
107
-
108
-
109
-
110
-
111
-
112
-
113
-
114
-
115
-
116
-
117
-
118
-
119
-
120
-
121
-
122
-
123
-
124
-
125
-
126
-
127
-
128
-
129
-
130
-
131
-
132
-
133
-
134
-
135
-
136
-
137
-
138
-
139
-
140
-
141
-
142
-
143
-
144
-
145
-
146
-
147
-
148
-
149
-
150
-
151
-
152
-
153
-
154
-
155
-
156
-
157
-
158
-
159
-
160
-
161
-
162
-
163
-
164
-
165
-
166
-
167
-
168
-
169
-
170
-
171
-
172
-
173
-
174
-
175
-
176
-
177
-
178
-
179
-
180
-
181
-
182
-
183
-
184
-
185
-
186
-
187
-
188
-
189
-
190
-
191
-
192
-
193
-
194
-
195
-
196
-
197
-
198
-
199
-
200
-
201
-
202
-
203
-
204
-
205
-
206
-
207
-
208
-
209
-
210
-
211
-
212
-
213
-
214
-
215
-
216
-
217
-
218
-
219
-
220
-
221
-
222
-
223
-
224
-
225
-
226
-
227
-
228
-
229
-
230
-
231
-
232
-
233
-
234
-
235
-
236
-
237
-
238
-
239
-
240
-
241
-
242
-
243
-
244
-
245
-
246
-
247
-
248
-
249
-
250
-
251
-
252
-
253
-
254
-
255
-
256
-
257
-
258
-
259
-
260
-
261
-
262
-
263
-
264
-
265
-
266
-
267
-
268
-
269
-
270
-
271
-
272
-
273
-
274
-
275
-
276
-
277
-
278
-
279
-
280
-
281
-
282
-
283
-
284
-
285
-
286
-
287
-
288
-
289
-
290
-
291
-
292
-
293
-
294
-
295
-
296
-
297
-
298
-
299
-
300
-
301
-
302
-
303
 |
 |
12 2014 | ANNUAL REPORT
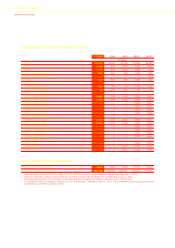
Selected Financial Data
CONSOLIDATED INCOME STATEMENT DATA
2014 2013 2012 2011(1) 2010(2)
(€ million)
Net revenues 96,090 86,624 83,765 59,559 35,880
EBIT 3,223 3,002 3,434 3,291 1,106
Profit before taxes 1,176 1,015 1,524 1,932 706
Profit from continuing operations 632 1,951 896 1,398 222
Profit/(loss) from discontinued operations —— — — 378
Net profit 632 1,951 896 1,398 600
Attributable to:
Owners of the parent 568 904 44 1,199 520
Non-controlling interest 64 1,047 852 199 80
Earnings/(loss) per share from continuing operations (in Euro)
Basic per ordinary share 0.465 0.744 0.036 0.962 0.130
Diluted per ordinary share 0.460 0.736 0.036 0.955 0.130
Basic per preference share —— — 0.962 0.217
Diluted per preference share —— — 0.955 0.217
Basic per savings share —— — 1.071 0.239
Diluted per savings share —— — 1.063 0.238
Earnings/(loss) per share (in Euro)
Basic per ordinary share 0.465 0.744 0.036 0.962 0.410
Diluted per ordinary share 0.460 0.736 0.036 0.955 0.409
Basic per preference share —— — 0.962 0.410
Diluted per preference share —— — 0.955 0.409
Basic per savings share —— — 1.071 0.565
Diluted per savings share —— — 1.063 0.564
Dividends paid per share (in Euro)(3)
Ordinary share —— — 0.090 0.170
Preference share(4) —— 0.217 0.310 0.310
Savings share(4) —— 0.217 0.310 0.325
Other Statistical Information (unaudited):
Shipments (in thousands of units) 4,608 4,352 4,223 3,175 2,094
Number of employees at period end 232,165 229,053 218,311 197,021 137,801
(1) Upon obtaining control of FCA US on May 24, 2011, FCA US’s financial results were consolidated beginning June 1, 2011.
(2) CNHI was reported as discontinued operations in 2010 as a result of its demerger from Fiat effective January 1, 2011.
(3) Dividends paid represent cash payments in the applicable year that generally relates to earnings of the previous year.
(4) In accordance with the resolution adopted by the shareholders’ meeting on April 4, 2012, Fiat’s preference and savings shares were
mandatorily converted into ordinary shares.