Chrysler 2014 Annual Report Download - page 223
Download and view the complete annual report
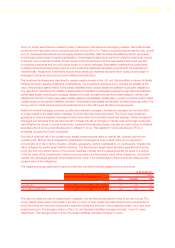
Please find page 223 of the 2014 Chrysler annual report below. You can navigate through the pages in the report by either clicking on the pages listed below, or by using the keyword search tool below to find specific information within the annual report.-
 1
1 -
2
-
3
-
4
-
5
-
6
-
7
-
8
-
9
-
10
-
11
-
12
-
13
-
14
-
15
-
16
-
17
-
18
-
19
-
20
-
21
-
22
-
23
-
24
-
25
-
26
-
27
-
28
-
29
-
30
-
31
-
32
-
33
-
34
-
35
-
36
-
37
-
38
-
39
-
40
-
41
-
42
-
43
-
44
-
45
-
46
-
47
-
48
-
49
-
50
-
51
-
52
-
53
-
54
-
55
-
56
-
57
-
58
-
59
-
60
-
61
-
62
-
63
-
64
-
65
-
66
-
67
-
68
-
69
-
70
-
71
-
72
-
73
-
74
-
75
-
76
-
77
-
78
-
79
-
80
-
81
-
82
-
83
-
84
-
85
-
86
-
87
-
88
-
89
-
90
-
91
-
92
-
93
-
94
-
95
-
96
-
97
-
98
-
99
-
100
-
101
-
102
-
103
-
104
-
105
-
106
-
107
-
108
-
109
-
110
-
111
-
112
-
113
-
114
-
115
-
116
-
117
-
118
-
119
-
120
-
121
-
122
-
123
-
124
-
125
-
126
-
127
-
128
-
129
-
130
-
131
-
132
-
133
-
134
-
135
-
136
-
137
-
138
-
139
-
140
-
141
-
142
-
143
-
144
-
145
-
146
-
147
-
148
-
149
-
150
-
151
-
152
-
153
-
154
-
155
-
156
-
157
-
158
-
159
-
160
-
161
-
162
-
163
-
164
-
165
-
166
-
167
-
168
-
169
-
170
-
171
-
172
-
173
-
174
-
175
-
176
-
177
-
178
-
179
-
180
-
181
-
182
-
183
-
184
-
185
-
186
-
187
-
188
-
189
-
190
-
191
-
192
-
193
-
194
-
195
-
196
-
197
-
198
-
199
-
200
-
201
-
202
-
203
-
204
-
205
-
206
-
207
-
208
-
209
-
210
-
211
-
212
-
 213
213 -
 214
214 -
 215
215 -
 216
216 -
 217
217 -
 218
218 -
 219
219 -
 220
220 -
 221
221 -
 222
222 -
 223
223 -
 224
224 -
 225
225 -
 226
226 -
 227
227 -
 228
228 -
 229
229 -
 230
230 -
 231
231 -
 232
232 -
 233
233 -
234
-
235
-
236
-
237
-
238
-
239
-
240
-
241
-
242
-
243
-
244
-
245
-
246
-
247
-
248
-
249
-
250
-
251
-
252
-
253
-
254
-
255
-
256
-
257
-
258
-
259
-
260
-
261
-
262
-
263
-
264
-
265
-
266
-
267
-
268
-
269
-
270
-
271
-
272
-
273
-
274
-
275
-
276
-
277
-
278
-
279
-
280
-
281
-
282
-
283
-
284
-
285
-
286
-
287
-
288
-
289
-
290
-
291
-
292
-
293
-
294
-
295
-
296
-
297
-
298
-
299
-
300
-
301
-
302
-
303
 |
 |

2014 | ANNUAL REPORT 221
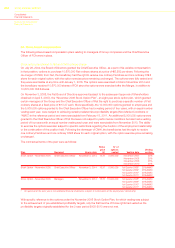
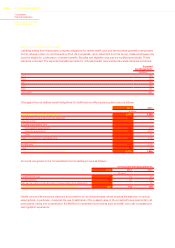
Liabilities arising from these plans are usually funded by contributions made by Group subsidiaries and, at times by
their employees, into legally separate trusts from which the employee benefits are paid. The Group’s funding policy
for defined benefit pension plans is to contribute the minimum amounts required by applicable laws and regulations.
Occasionally, additional discretionary contributions in excess of these legally required are made to achieve certain
desired funding levels. In the U.S. these excess amounts are tracked, and the resulting credit balance can be used to
satisfy minimum funding requirements in future years. As of December 31, 2014, the combined credit balances for the
U.S. and Canadian qualified pension plans was approximately €2.1 billion, the usage of the credit balances to satisfy
minimum funding requirements is subject to the plans maintaining certain funding levels. The Group contributions to
funded pension plans for 2015 are expected to be €284 million, of which €262 million relate to FCA US and more
specifically, €191 million are discretionary contributions and €71 million will be made to satisfy minimum funding
requirement. The expected benefit payments for pension plans are as follows:
Expected benefit
payments
(€ million)
2015 1,769
2016 1,733
2017 1,710
2018 1,688
2019 1,675
2020-2024 8,187
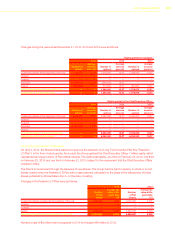
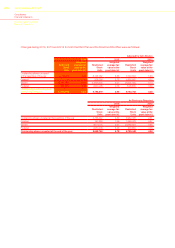
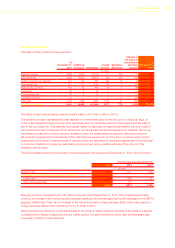
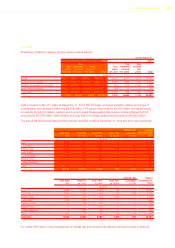
The following summarizes the changes in the pension plans:
2014 2013
Obligation
Fair value
of plan
assets
Asset
ceiling
Liability
(asset) Obligation
Fair value
of plan
assets
Asset
ceiling
Liability
(asset)
(€ million)
Amounts at January 1, 23,137 (18,982) 3 4,158 26,974 (20,049) — 6,925
Included in the Consolidated income
statement 1,290 (816) — 474 1,142 (712) — 430
Included in Other comprehensive
income/loss
Actuarial losses/(gains) from:
- Demographic assumptions (256) — — (256) (35) — — (35)
- Financial assumptions 1,916 (8) — 1,908 (1,943) (1) — (1,944)
- Other 2 — — 2(2) 2 — —
Return on assets — (1,514) — (1,514) — (518) — (518)
Changes in the effect of limiting net assets — — 3 3— — 3 3
Changes in exchange rates 2,802 (2,273) — 529 (1,352) 1,107 — (245)
Other
Employer contributions — (229) — (229) — (458) — (458)
Plan participant contributions 2 (2) — —9 (9) — —
Benefits paid (1,611) 1,606 — (5) (1,673) 1,667 — (6)
Other changes 5 (13) — (8) 17 (11) — 6
Amounts at December 31, 27,287 (22,231) 6 5,062 23,137 (18,982) 3 4,158
During 2014, a decrease in discount rates resulted in actuarial losses for the year ended December 31, 2014, while an
increase in discount rates resulted in actuarial gains for the year ended December 31, 2013.