Chrysler 2014 Annual Report Download - page 195
Download and view the complete annual report
Please find page 195 of the 2014 Chrysler annual report below. You can navigate through the pages in the report by either clicking on the pages listed below, or by using the keyword search tool below to find specific information within the annual report.-
 1
1 -
2
-
3
-
4
-
5
-
6
-
7
-
8
-
9
-
10
-
11
-
12
-
13
-
14
-
15
-
16
-
17
-
18
-
19
-
20
-
21
-
22
-
23
-
24
-
25
-
26
-
27
-
28
-
29
-
30
-
31
-
32
-
33
-
34
-
35
-
36
-
37
-
38
-
39
-
40
-
41
-
42
-
43
-
44
-
45
-
46
-
47
-
48
-
49
-
50
-
51
-
52
-
53
-
54
-
55
-
56
-
57
-
58
-
59
-
60
-
61
-
62
-
63
-
64
-
65
-
66
-
67
-
68
-
69
-
70
-
71
-
72
-
73
-
74
-
75
-
76
-
77
-
78
-
79
-
80
-
81
-
82
-
83
-
84
-
85
-
86
-
87
-
88
-
89
-
90
-
91
-
92
-
93
-
94
-
95
-
96
-
97
-
98
-
99
-
100
-
101
-
102
-
103
-
104
-
105
-
106
-
107
-
108
-
109
-
110
-
111
-
112
-
113
-
114
-
115
-
116
-
117
-
118
-
119
-
120
-
121
-
122
-
123
-
124
-
125
-
126
-
127
-
128
-
129
-
130
-
131
-
132
-
133
-
134
-
135
-
136
-
137
-
138
-
139
-
140
-
141
-
142
-
143
-
144
-
145
-
146
-
147
-
148
-
149
-
150
-
151
-
152
-
153
-
154
-
155
-
156
-
157
-
158
-
159
-
160
-
161
-
162
-
163
-
164
-
165
-
166
-
167
-
168
-
169
-
170
-
171
-
172
-
173
-
174
-
175
-
176
-
177
-
178
-
179
-
180
-
181
-
182
-
183
-
184
-
 185
185 -
 186
186 -
 187
187 -
 188
188 -
 189
189 -
 190
190 -
 191
191 -
 192
192 -
 193
193 -
 194
194 -
 195
195 -
 196
196 -
 197
197 -
 198
198 -
 199
199 -
 200
200 -
 201
201 -
 202
202 -
 203
203 -
 204
204 -
 205
205 -
206
-
207
-
208
-
209
-
210
-
211
-
212
-
213
-
214
-
215
-
216
-
217
-
218
-
219
-
220
-
221
-
222
-
223
-
224
-
225
-
226
-
227
-
228
-
229
-
230
-
231
-
232
-
233
-
234
-
235
-
236
-
237
-
238
-
239
-
240
-
241
-
242
-
243
-
244
-
245
-
246
-
247
-
248
-
249
-
250
-
251
-
252
-
253
-
254
-
255
-
256
-
257
-
258
-
259
-
260
-
261
-
262
-
263
-
264
-
265
-
266
-
267
-
268
-
269
-
270
-
271
-
272
-
273
-
274
-
275
-
276
-
277
-
278
-
279
-
280
-
281
-
282
-
283
-
284
-
285
-
286
-
287
-
288
-
289
-
290
-
291
-
292
-
293
-
294
-
295
-
296
-
297
-
298
-
299
-
300
-
301
-
302
-
303
 |
 |

2014 | ANNUAL REPORT 193
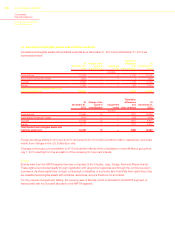
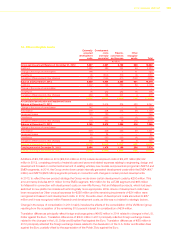
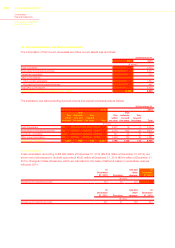
14. Other intangible assets
Externally
acquired
development
costs
Development
costs
internally
generated
Patents,
concessions
and licenses
Other
intangible
assets Total
(€ million)
Gross carrying amount Balance at December 31, 2012 5,227 4,637 2,100 638 12,602
Additions 1,562 480 224 64 2,330
Change in the scope of consolidation 198 — 1 21 220
Divestitures (5) (304) (19) (2) (330)
Translation differences and other changes (123) (159) (21) (100) (403)
Balance at December 31, 2013 6,859 4,654 2,285 621 14,419
Additions 1,542 725 350 89 2,706
Change in the scope of consolidation — — — — —
Divestitures (8) (36) (38) (6) (88)
Translation differences and other changes 239 168 207 4 618
Balance at December 31, 2014 8,632 5,511 2,804 708 17,655
Accumulated amortization and impairment losses
Balance at December 31, 2012 2,436 2,516 875 430 6,257
Change in the scope of consolidation 142 — — 11 153
Amortization 479 408 213 48 1,148
Impairment losses 120 130 — — 250
Divestitures (1) (286) (18) (1) (306)
Translation differences and other changes (11) (90) 16 (72) (157)
Balance at December 31, 2013 3,165 2,678 1,086 416 7,345
Change in the scope of consolidation — — — — —
Amortization 648 409 225 49 1,331
Impairment losses 46 36 — — 82
Divestitures (6) (30) (33) (4) (73)
Translation differences and other changes (84) 152 59 8 135
Balance at December 31, 2014 3,769 3,245 1,337 469 8,820
Carrying amount at December 31, 2013 3,694 1,976 1,199 205 7,074
Carrying amount at December 31, 2014 4,863 2,266 1,467 239 8,835
Additions of €2,706 million in 2014 (€2,330 million in 2013) include development costs of €2,267 million (€2,042
million in 2013), consisting primarily of material costs and personnel related expenses relating to engineering, design and
development focused on content enhancement of existing vehicles, new models and powertrain programs in NAFTA and
EMEA segments. In 2014, the Group wrote-down certain internally generated development costs within the EMEA (€47
million) and NAFTA (€28 million) segments primarily in connection with changes in certain product developments.
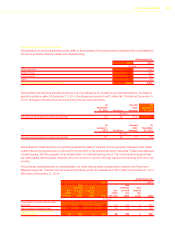
In 2013, to reflect the new product strategy the Group wrote-down certain development costs by €250 million. This
amount mainly includes €151 million for the EMEA segment, €32 million for the LATAM segment and €65 million
for Maserati in connection with development costs on new Alfa Romeo, Fiat and Maserati products, which had been
switched to new platforms considered technologically more appropriate. Write-downs of development costs have
been recognized as Other unusual expenses for €226 million and the remaining impairments of €24 million were
recognized in Research and development costs. In 2012, the write-down of development costs amounted to €57
million and it was recognized within Research and development costs, as this was not related to strategic factors.
Change in the scope of consolidation in 2013 mainly includes the effects of the consolidation of the VM Motori group
resulting from the acquisition of the remaining 50.0 percent interest for consideration of €34 million.
Translation differences principally reflect foreign exchange gains of €482 million in 2014 related to changes in the U.S.
Dollar against the Euro. Translation differences of €243 million in 2013 principally reflected foreign exchange losses
related to the changes in the U.S. Dollar and Brazilian Real against the Euro. Translation differences of €88 million in
2012 principally reflected the foreign exchange losses related to the devaluation of the U.S. Dollar and Brazilian Real
against the Euro, partially offset by the appreciation of the Polish Zloty against the Euro.