Chrysler 2014 Annual Report Download - page 240
Download and view the complete annual report
Please find page 240 of the 2014 Chrysler annual report below. You can navigate through the pages in the report by either clicking on the pages listed below, or by using the keyword search tool below to find specific information within the annual report.-
 1
1 -
2
-
3
-
4
-
5
-
6
-
7
-
8
-
9
-
10
-
11
-
12
-
13
-
14
-
15
-
16
-
17
-
18
-
19
-
20
-
21
-
22
-
23
-
24
-
25
-
26
-
27
-
28
-
29
-
30
-
31
-
32
-
33
-
34
-
35
-
36
-
37
-
38
-
39
-
40
-
41
-
42
-
43
-
44
-
45
-
46
-
47
-
48
-
49
-
50
-
51
-
52
-
53
-
54
-
55
-
56
-
57
-
58
-
59
-
60
-
61
-
62
-
63
-
64
-
65
-
66
-
67
-
68
-
69
-
70
-
71
-
72
-
73
-
74
-
75
-
76
-
77
-
78
-
79
-
80
-
81
-
82
-
83
-
84
-
85
-
86
-
87
-
88
-
89
-
90
-
91
-
92
-
93
-
94
-
95
-
96
-
97
-
98
-
99
-
100
-
101
-
102
-
103
-
104
-
105
-
106
-
107
-
108
-
109
-
110
-
111
-
112
-
113
-
114
-
115
-
116
-
117
-
118
-
119
-
120
-
121
-
122
-
123
-
124
-
125
-
126
-
127
-
128
-
129
-
130
-
131
-
132
-
133
-
134
-
135
-
136
-
137
-
138
-
139
-
140
-
141
-
142
-
143
-
144
-
145
-
146
-
147
-
148
-
149
-
150
-
151
-
152
-
153
-
154
-
155
-
156
-
157
-
158
-
159
-
160
-
161
-
162
-
163
-
164
-
165
-
166
-
167
-
168
-
169
-
170
-
171
-
172
-
173
-
174
-
175
-
176
-
177
-
178
-
179
-
180
-
181
-
182
-
183
-
184
-
185
-
186
-
187
-
188
-
189
-
190
-
191
-
192
-
193
-
194
-
195
-
196
-
197
-
198
-
199
-
200
-
201
-
202
-
203
-
204
-
205
-
206
-
207
-
208
-
209
-
210
-
211
-
212
-
213
-
214
-
215
-
216
-
217
-
218
-
219
-
220
-
221
-
222
-
223
-
224
-
225
-
226
-
227
-
228
-
229
-
 230
230 -
 231
231 -
 232
232 -
 233
233 -
 234
234 -
 235
235 -
 236
236 -
 237
237 -
 238
238 -
 239
239 -
 240
240 -
 241
241 -
 242
242 -
 243
243 -
 244
244 -
 245
245 -
 246
246 -
 247
247 -
 248
248 -
 249
249 -
 250
250 -
251
-
252
-
253
-
254
-
255
-
256
-
257
-
258
-
259
-
260
-
261
-
262
-
263
-
264
-
265
-
266
-
267
-
268
-
269
-
270
-
271
-
272
-
273
-
274
-
275
-
276
-
277
-
278
-
279
-
280
-
281
-
282
-
283
-
284
-
285
-
286
-
287
-
288
-
289
-
290
-
291
-
292
-
293
-
294
-
295
-
296
-
297
-
298
-
299
-
300
-
301
-
302
-
303
 |
 |
238 2014 | ANNUAL REPORT
Consolidated
Financial Statements
Notes to the Consolidated
Financial Statements
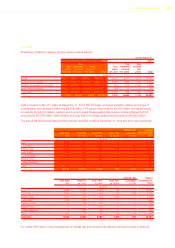
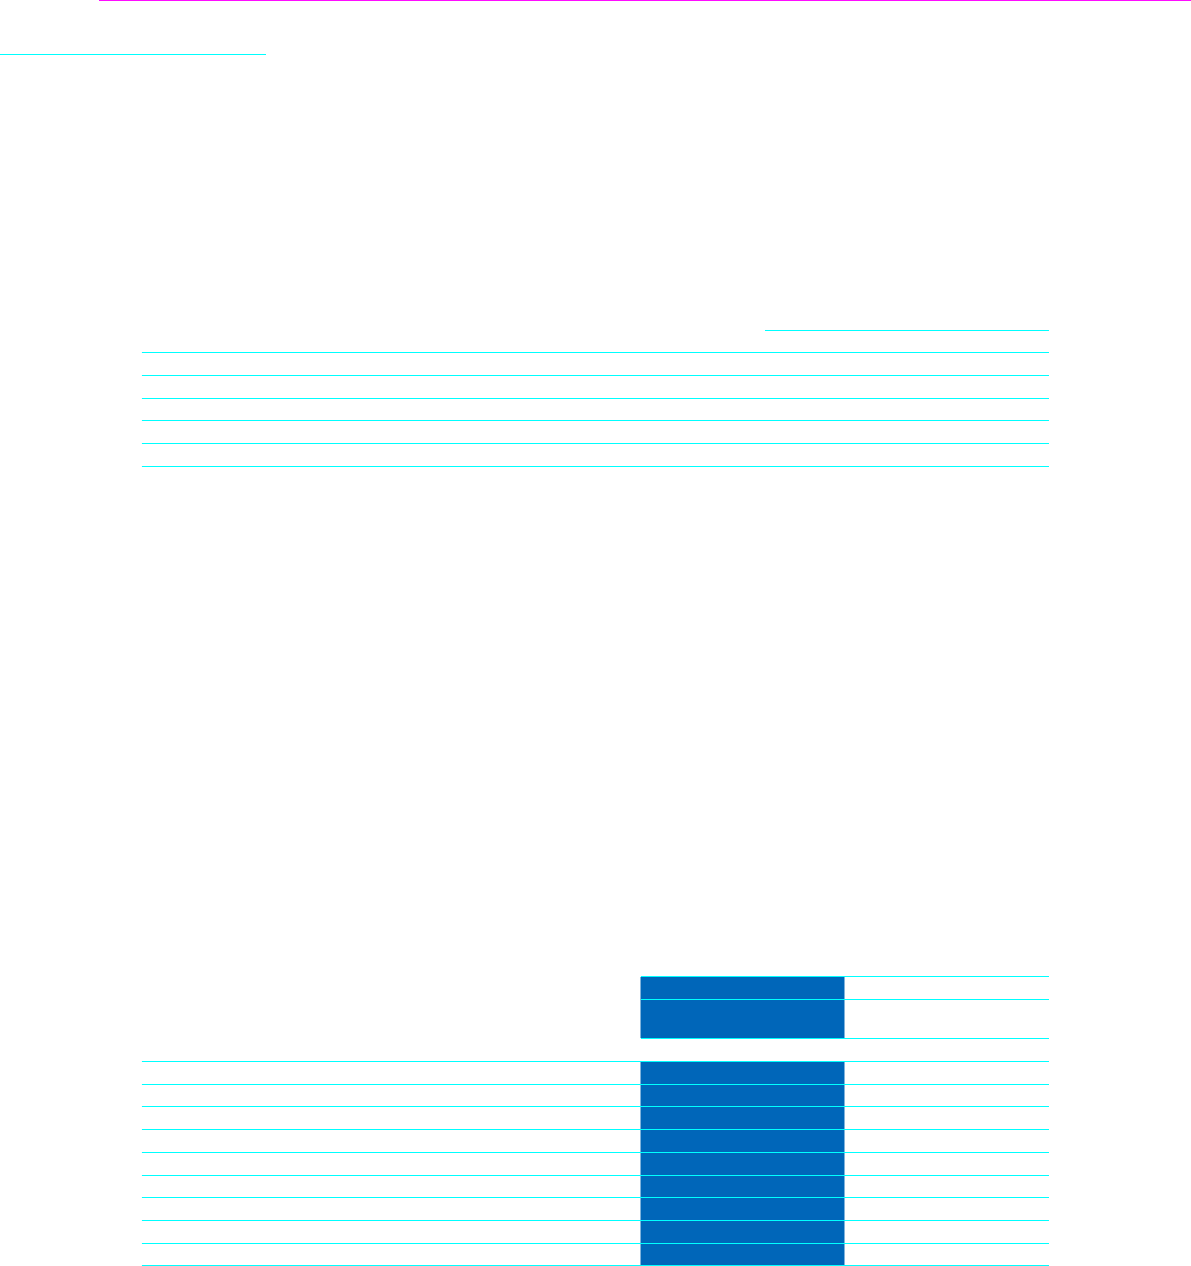
The following table provides a reconciliation for the changes in items measured at fair value and categorized as Level 3
in 2014:
Other non-current
securities
Other financial
assets/(liabilities)
(€ million)
At December 31, 2013 12 2
Gains/(Losses) recognized in Consolidated income statement — 16
Gains/(Losses) recognized in Other comprehensive income/loss — (8)
Issues/Settlements 10 (14)
At December 31, 2014 22 (4)
The gains/losses included in the Consolidated income statement are recognized in Cost of sales for €16 million. The
gains and losses recognized in Other comprehensive income/(loss) have been included in Gains/(losses) on cash flow
hedging instruments for €8 million.
Assets and liabilities not measured at fair value on recurring basis
For financial instruments represented by short-term receivables and payables, for which the present value of
future cash flows does not differ significantly from carrying value, we assume that carrying value is a reasonable
approximation of the fair value. In particular, the carrying amount of Current receivables and Other current assets and
of Trade payables and Other current liabilities approximates their fair value.
Refer to Note 23 and Note 27 for a detailed discussion of the allocation of the fair value of the liability component of the
Mandatory Convertible Securities issued by FCA in December 2014.
Refer to section —Acquisition of the remaining ownership interest in FCA US for a discussion of the residual value
methodology used to determine the fair values of the acquired elements in connection with the transactions under the
Equity Recapture Agreement and MOU.
The following table represents carrying amount and fair value for the most relevant categories of financial assets and
liabilities not measured at fair value on a recurring basis:
At December 31,
2014 2013
Carrying
amount
Fair
Value
Carrying
amount
Fair
Value
Note (€ million)
Dealer financing 2,313 2,312 2,286 2,290
Retail financing 1,039 1,032 970 957
Finance lease 349 351 297 296
Other receivables from financing activities 142 142 118 118
Receivables from financing activities (18) 3,843 3,837 3,671 3,661
Asset backed financing 469 469 756 756
Bonds 17,648 18,794 14,466 15,464
Other debt 15,607 15,685 15,061 15,180
Debt (27) 33,724 34,948 30,283 31,400
The fair values of Receivables from financing activities, which are categorized within the Level 3 of the fair value
hierarchy, have been estimated with discounted cash flows models. The most significant inputs used for this
measurement are market discount rates that reflect conditions applied in various reference markets on receivables
with similar characteristics, adjusted in order to take into account the credit risk of the counterparties.