Chrysler 2014 Annual Report Download - page 245
Download and view the complete annual report
Please find page 245 of the 2014 Chrysler annual report below. You can navigate through the pages in the report by either clicking on the pages listed below, or by using the keyword search tool below to find specific information within the annual report.-
 1
1 -
2
-
3
-
4
-
5
-
6
-
7
-
8
-
9
-
10
-
11
-
12
-
13
-
14
-
15
-
16
-
17
-
18
-
19
-
20
-
21
-
22
-
23
-
24
-
25
-
26
-
27
-
28
-
29
-
30
-
31
-
32
-
33
-
34
-
35
-
36
-
37
-
38
-
39
-
40
-
41
-
42
-
43
-
44
-
45
-
46
-
47
-
48
-
49
-
50
-
51
-
52
-
53
-
54
-
55
-
56
-
57
-
58
-
59
-
60
-
61
-
62
-
63
-
64
-
65
-
66
-
67
-
68
-
69
-
70
-
71
-
72
-
73
-
74
-
75
-
76
-
77
-
78
-
79
-
80
-
81
-
82
-
83
-
84
-
85
-
86
-
87
-
88
-
89
-
90
-
91
-
92
-
93
-
94
-
95
-
96
-
97
-
98
-
99
-
100
-
101
-
102
-
103
-
104
-
105
-
106
-
107
-
108
-
109
-
110
-
111
-
112
-
113
-
114
-
115
-
116
-
117
-
118
-
119
-
120
-
121
-
122
-
123
-
124
-
125
-
126
-
127
-
128
-
129
-
130
-
131
-
132
-
133
-
134
-
135
-
136
-
137
-
138
-
139
-
140
-
141
-
142
-
143
-
144
-
145
-
146
-
147
-
148
-
149
-
150
-
151
-
152
-
153
-
154
-
155
-
156
-
157
-
158
-
159
-
160
-
161
-
162
-
163
-
164
-
165
-
166
-
167
-
168
-
169
-
170
-
171
-
172
-
173
-
174
-
175
-
176
-
177
-
178
-
179
-
180
-
181
-
182
-
183
-
184
-
185
-
186
-
187
-
188
-
189
-
190
-
191
-
192
-
193
-
194
-
195
-
196
-
197
-
198
-
199
-
200
-
201
-
202
-
203
-
204
-
205
-
206
-
207
-
208
-
209
-
210
-
211
-
212
-
213
-
214
-
215
-
216
-
217
-
218
-
219
-
220
-
221
-
222
-
223
-
224
-
225
-
226
-
227
-
228
-
229
-
230
-
231
-
232
-
233
-
234
-
 235
235 -
 236
236 -
 237
237 -
 238
238 -
 239
239 -
 240
240 -
 241
241 -
 242
242 -
 243
243 -
 244
244 -
 245
245 -
 246
246 -
 247
247 -
 248
248 -
 249
249 -
 250
250 -
 251
251 -
 252
252 -
 253
253 -
 254
254 -
 255
255 -
256
-
257
-
258
-
259
-
260
-
261
-
262
-
263
-
264
-
265
-
266
-
267
-
268
-
269
-
270
-
271
-
272
-
273
-
274
-
275
-
276
-
277
-
278
-
279
-
280
-
281
-
282
-
283
-
284
-
285
-
286
-
287
-
288
-
289
-
290
-
291
-
292
-
293
-
294
-
295
-
296
-
297
-
298
-
299
-
300
-
301
-
302
-
303
 |
 |

2014 | ANNUAL REPORT 243
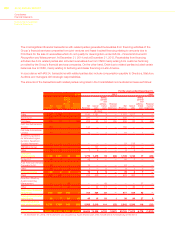
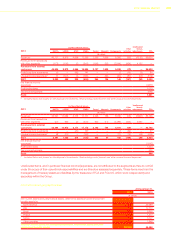
32. Explanatory notes to the Consolidated statement of cash flows
The Consolidated statement of cash flows sets out changes in Cash and cash equivalents during the year. As required
by IAS 7 – Statement of cash flows, cash flows are separated into operating, investing and financing activities.
The effects of changes in exchange rates on cash and cash equivalents are shown separately under the line item
Translation exchange differences.
Cash flows provided by operating activities are mostly derived from the Group’s industrial activities.
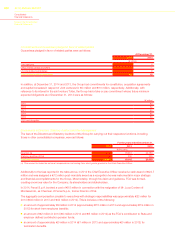
The cash flows generated by the sale of vehicles under buy-back commitments and GDP vehicles, net of the amounts
included in Profit/(loss) for the year, are included under operating activities in a single line item which includes changes
in working capital arising from these transactions.
For the year ended December 31, 2014, Other non-cash items of €352 million mainly included (i) €381 million related
to the non-cash portion of the expense recognized in connection with the execution of the UAW MOU entered into by
FCA US on January 21, 2014, as described in the section —Acquisition of the remaining ownership interest in FCA
US, and (ii) €98 million remeasurement charge recognized as a result of the Group’s change in the exchange rate
used to remeasure its Venezuelan subsidiary’s net monetary assets in U.S. Dollars (Note 8) (reported, for the effect on
cash and cash equivalents, within “Translation exchange differences”) which were partially offset by (iii) the non-taxable
gain of €223 million on the remeasurement to fair value of the previously exercised options on approximately 10
percent of FCA US’s membership interest in connection with the Equity Purchase Agreement described above in the
section —Acquisition of the remaining ownership interest in FCA US.
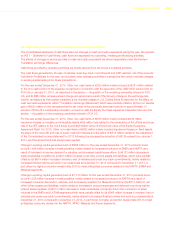
For the year ended December 31, 2013, Other non-cash items of €535 million mainly included €336 million
impairment losses on tangible and intangible assets, €59 million loss related to the devaluation of the official exchange
rate of the VEF relative to the U.S.$ (Note 8) and €56 million write-off of the book value of the Equity Recapture
Agreement Right. For 2012, Other non-cash items of €582 million mainly included impairment losses on fixed assets,
the share of the net profit and loss of equity method investees and the effect of €515 million related to the adjustment
of the Consolidated income statement for 2012 following the retrospective adoption of IAS 19 revised from January 1,
2013, as if the amendment had always been applied.
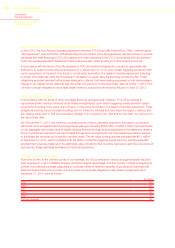
Change in working capital generated cash of €965 million for the year ended December 31, 2014 primarily driven
by (a) €1,495 million increase in trade payables, mainly related to increased production in EMEA and NAFTA as a
result of increased consumer demand for vehicles, and increased capital expenditure, (b) €123 million decrease in
trade receivables in addition to (c) €21 million increase in net other current assets and liabilities, which were partially
offset by (d) €674 million increase in inventory (net of vehicles sold under buy-back commitments), mainly related to
increased finished vehicle and work in process levels at December 31, 2014 compared to December 31, 2013, in
part driven by higher production levels in late 2014 to meet anticipated consumer demand in the NAFTA, EMEA and
Maserati segments.
Change in working capital generated cash of €1,410 million for the year ended December 31, 2013 primarily driven
by (a) €1,328 million increase in trade payables, mainly related to increased production in NAFTA as a result of
increased consumer demand for vehicles, and increased production for Maserati and Ferrari (b) €817 million in net
other current assets and liabilities, mainly related to increases in accrued expenses and deferred income as well as
indirect taxes payables, (c) €213 million decrease in trade receivables, principally due to the contraction of sales
volumes in the EMEA and LATAM segments which were partially offset by (d) €948 million increase in inventory (net of
vehicles sold under buy-back commitments), mainly related to increased finished vehicle and work in process levels at
December 31, 2013 compared to December 31, 2012, in part driven by higher production levels in late 2013 to meet
anticipated consumer demand in the NAFTA, APAC, Maserati and Ferrari segments.