Chrysler 2014 Annual Report Download - page 160
Download and view the complete annual report
Please find page 160 of the 2014 Chrysler annual report below. You can navigate through the pages in the report by either clicking on the pages listed below, or by using the keyword search tool below to find specific information within the annual report.-
 1
1 -
 2
2 -
 3
3 -
 4
4 -
 5
5 -
 6
6 -
 7
7 -
 8
8 -
 9
9 -
 10
10 -
 11
11 -
 12
12 -
 13
13 -
 14
14 -
 15
15 -
 16
16 -
 17
17 -
 18
18 -
 19
19 -
 20
20 -
 21
21 -
 22
22 -
 23
23 -
 24
24 -
 25
25 -
 26
26 -
 27
27 -
 28
28 -
 29
29 -
 30
30 -
 31
31 -
 32
32 -
 33
33 -
 34
34 -
 35
35 -
 36
36 -
 37
37 -
 38
38 -
 39
39 -
 40
40 -
 41
41 -
 42
42 -
 43
43 -
 44
44 -
 45
45 -
 46
46 -
 47
47 -
 48
48 -
 49
49 -
 50
50 -
 51
51 -
 52
52 -
 53
53 -
 54
54 -
 55
55 -
 56
56 -
 57
57 -
 58
58 -
 59
59 -
 60
60 -
 61
61 -
 62
62 -
 63
63 -
 64
64 -
 65
65 -
 66
66 -
 67
67 -
 68
68 -
 69
69 -
 70
70 -
 71
71 -
 72
72 -
 73
73 -
 74
74 -
 75
75 -
 76
76 -
 77
77 -
 78
78 -
 79
79 -
 80
80 -
 81
81 -
 82
82 -
 83
83 -
 84
84 -
 85
85 -
 86
86 -
 87
87 -
 88
88 -
 89
89 -
 90
90 -
 91
91 -
 92
92 -
 93
93 -
 94
94 -
 95
95 -
 96
96 -
 97
97 -
 98
98 -
 99
99 -
 100
100 -
 101
101 -
 102
102 -
 103
103 -
 104
104 -
 105
105 -
 106
106 -
 107
107 -
 108
108 -
 109
109 -
 110
110 -
 111
111 -
 112
112 -
 113
113 -
 114
114 -
 115
115 -
 116
116 -
 117
117 -
 118
118 -
 119
119 -
 120
120 -
 121
121 -
 122
122 -
 123
123 -
 124
124 -
 125
125 -
 126
126 -
 127
127 -
 128
128 -
 129
129 -
 130
130 -
 131
131 -
 132
132 -
 133
133 -
 134
134 -
 135
135 -
 136
136 -
 137
137 -
 138
138 -
 139
139 -
 140
140 -
 141
141 -
 142
142 -
 143
143 -
 144
144 -
 145
145 -
 146
146 -
 147
147 -
 148
148 -
 149
149 -
 150
150 -
 151
151 -
 152
152 -
 153
153 -
 154
154 -
 155
155 -
 156
156 -
 157
157 -
 158
158 -
 159
159 -
 160
160 -
 161
161 -
 162
162 -
 163
163 -
 164
164 -
 165
165 -
 166
166 -
 167
167 -
 168
168 -
 169
169 -
 170
170 -
 171
171 -
 172
172 -
 173
173 -
 174
174 -
 175
175 -
 176
176 -
 177
177 -
 178
178 -
 179
179 -
 180
180 -
 181
181 -
 182
182 -
 183
183 -
 184
184 -
 185
185 -
 186
186 -
 187
187 -
 188
188 -
 189
189 -
 190
190 -
 191
191 -
 192
192 -
 193
193 -
 194
194 -
 195
195 -
 196
196 -
 197
197 -
 198
198 -
 199
199 -
 200
200 -
 201
201 -
 202
202 -
 203
203 -
 204
204 -
 205
205 -
 206
206 -
 207
207 -
 208
208 -
 209
209 -
 210
210 -
 211
211 -
 212
212 -
 213
213 -
 214
214 -
 215
215 -
 216
216 -
 217
217 -
 218
218 -
 219
219 -
 220
220 -
 221
221 -
 222
222 -
 223
223 -
 224
224 -
 225
225 -
 226
226 -
 227
227 -
 228
228 -
 229
229 -
 230
230 -
 231
231 -
 232
232 -
 233
233 -
 234
234 -
 235
235 -
 236
236 -
 237
237 -
 238
238 -
 239
239 -
 240
240 -
 241
241 -
 242
242 -
 243
243 -
 244
244 -
 245
245 -
 246
246 -
 247
247 -
 248
248 -
 249
249 -
 250
250 -
 251
251 -
 252
252 -
 253
253 -
 254
254 -
 255
255 -
 256
256 -
 257
257 -
 258
258 -
 259
259 -
 260
260 -
 261
261 -
 262
262 -
 263
263 -
 264
264 -
 265
265 -
 266
266 -
 267
267 -
 268
268 -
 269
269 -
 270
270 -
 271
271 -
 272
272 -
 273
273 -
 274
274 -
 275
275 -
 276
276 -
 277
277 -
 278
278 -
 279
279 -
 280
280 -
 281
281 -
 282
282 -
 283
283 -
 284
284 -
 285
285 -
 286
286 -
 287
287 -
 288
288 -
 289
289 -
 290
290 -
 291
291 -
 292
292 -
 293
293 -
 294
294 -
 295
295 -
 296
296 -
 297
297 -
 298
298 -
 299
299 -
 300
300 -
 301
301 -
 302
302 -
 303
303
 |
 |

158 2014 | ANNUAL REPORT
Consolidated
Financial Statements
Notes to the Consolidated
Financial Statements
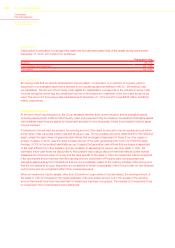
Depreciation
Depreciation is calculated on a straight-line basis over the estimated useful lives of the assets during years ended
December 31, 2014, 2013 and 2012, as follows:
Depreciation rates
Buildings 3% - 8%
Plant, machinery and equipment 3% - 33%
Other assets 5% - 33%
Borrowing Costs
Borrowing costs that are directly attributable to the acquisition, construction or production of property, plant or
equipment or an intangible asset that is deemed to be a qualifying asset as defined in IAS 23 - Borrowing Costs
are capitalized. The amount of borrowing costs eligible for capitalization corresponds to the actual borrowing costs
incurred during the period less any investment income on the temporary investment of any borrowed funds not yet
used. The amount of borrowing costs capitalized as of December 31, 2014 and 2013 was €256 million and €230
million, respectively.
Impairment of assets
At the end of each reporting period, the Group assesses whether there is any indication that its Intangible assets
(including development costs) and its Property, plant and equipment may be impaired. Goodwill and Intangible assets
with indefinite useful lives are tested for impairment annually or more frequently, if there is an indication that an asset
may be impaired.
If indications of impairment are present, the carrying amount of the asset is reduced to its recoverable amount which
is the higher of fair value less costs to sell and its value in use. The recoverable amount is determined for the individual
asset, unless the asset does not generate cash inflows that are largely independent of those from other assets or
groups of assets, in which case the asset is tested as part of the cash-generating unit (“CGU”) to which the asset
belongs. A CGU is the smallest identifiable group of assets that generates cash inflows that are largely independent
of the cash inflows from other assets or groups of assets. In assessing the value in use of an asset or CGU, the
estimated future cash flows are discounted to their present value using a discount rate that reflects current market
assessments of the time value of money and the risks specific to the asset or CGU. An impairment loss is recognized
if the recoverable amount is lower than the carrying amount. Impairment of Property plant and equipment and
Intangible assets arising from transactions that are only incidentally related to the ordinary activities of the Group and
that are not expected to occur frequently, are considered to hinder comparability of the Group’s year-on-year financial
performance and are recognized within Other unusual expenses.
When an impairment loss for assets, other than Goodwill no longer exists or has decreased, the carrying amount of
the asset or CGU is increased to the revised estimate of its recoverable amount, but not in excess of the carrying
amount that would have been recorded had no impairment loss been recognized. The reversal of an impairment loss
is recognized in the Consolidated income statement.
