Chrysler 2014 Annual Report Download - page 16
Download and view the complete annual report
Please find page 16 of the 2014 Chrysler annual report below. You can navigate through the pages in the report by either clicking on the pages listed below, or by using the keyword search tool below to find specific information within the annual report.-
 1
1 -
2
-
3
-
4
-
5
-
 6
6 -
 7
7 -
 8
8 -
 9
9 -
 10
10 -
 11
11 -
 12
12 -
 13
13 -
 14
14 -
 15
15 -
 16
16 -
 17
17 -
 18
18 -
 19
19 -
 20
20 -
 21
21 -
 22
22 -
 23
23 -
 24
24 -
 25
25 -
 26
26 -
27
-
28
-
29
-
30
-
31
-
32
-
33
-
34
-
35
-
36
-
37
-
38
-
39
-
40
-
41
-
42
-
43
-
44
-
45
-
46
-
47
-
48
-
49
-
50
-
51
-
52
-
53
-
54
-
55
-
56
-
57
-
58
-
59
-
60
-
61
-
62
-
63
-
64
-
65
-
66
-
67
-
68
-
69
-
70
-
71
-
72
-
73
-
74
-
75
-
76
-
77
-
78
-
79
-
80
-
81
-
82
-
83
-
84
-
85
-
86
-
87
-
88
-
89
-
90
-
91
-
92
-
93
-
94
-
95
-
96
-
97
-
98
-
99
-
100
-
101
-
102
-
103
-
104
-
105
-
106
-
107
-
108
-
109
-
110
-
111
-
112
-
113
-
114
-
115
-
116
-
117
-
118
-
119
-
120
-
121
-
122
-
123
-
124
-
125
-
126
-
127
-
128
-
129
-
130
-
131
-
132
-
133
-
134
-
135
-
136
-
137
-
138
-
139
-
140
-
141
-
142
-
143
-
144
-
145
-
146
-
147
-
148
-
149
-
150
-
151
-
152
-
153
-
154
-
155
-
156
-
157
-
158
-
159
-
160
-
161
-
162
-
163
-
164
-
165
-
166
-
167
-
168
-
169
-
170
-
171
-
172
-
173
-
174
-
175
-
176
-
177
-
178
-
179
-
180
-
181
-
182
-
183
-
184
-
185
-
186
-
187
-
188
-
189
-
190
-
191
-
192
-
193
-
194
-
195
-
196
-
197
-
198
-
199
-
200
-
201
-
202
-
203
-
204
-
205
-
206
-
207
-
208
-
209
-
210
-
211
-
212
-
213
-
214
-
215
-
216
-
217
-
218
-
219
-
220
-
221
-
222
-
223
-
224
-
225
-
226
-
227
-
228
-
229
-
230
-
231
-
232
-
233
-
234
-
235
-
236
-
237
-
238
-
239
-
240
-
241
-
242
-
243
-
244
-
245
-
246
-
247
-
248
-
249
-
250
-
251
-
252
-
253
-
254
-
255
-
256
-
257
-
258
-
259
-
260
-
261
-
262
-
263
-
264
-
265
-
266
-
267
-
268
-
269
-
270
-
271
-
272
-
273
-
274
-
275
-
276
-
277
-
278
-
279
-
280
-
281
-
282
-
283
-
284
-
285
-
286
-
287
-
288
-
289
-
290
-
291
-
292
-
293
-
294
-
295
-
296
-
297
-
298
-
299
-
300
-
301
-
302
-
303
 |
 |

14 2014 | ANNUAL REPORT
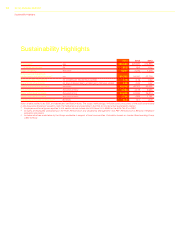
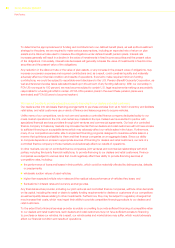
Sustainability Highlights
Sustainability Highlights
2014 2013 2012
Employees(1) (no.) 228,690 225,587 214,836
of which are women (%) 20.3 19.6 19.2
Hours of training (thousand) 4,297 4,232 4,206
Employees participating in
performance evaluation process(2) (no.) 60,700 54,500 52,700
Frequency rate of accidents (no. accidents per 100,000 hours worked) 0.15 0.19 0.22
Severity rate of accidents (no. days of absence due to accidents per 1,000 hours worked) 0.05 0.06 0.07
Energy consumption by plants (terajoules) 48,645 48,322 45,692
CO2 emissions by plants (thousands of tons) 4,283 4,178 3,965
Water withdrawal by plants (thousands of m3)24,653 24,936 25,874
Waste generated by plants (thousands of tons) 1,744 1,809 1,761
Contributions to local communities(3) (€ million) 24.2 19.7 20.8
Note: all data audited is by SGS, an independent certification body. The scope, methodology, limitations and conclusions of the audit are provided
in the Assurance Statement issued by SGS The Netherlands and published in the FCA 2014 interactive Sustainability Report.
(1) Employee workforce figures reported in this section do not include the 50% Sevel JV in EMEA or the 50% Fial JV in APAC.
(2) Includes all employees participating in the PLM (Performance and Leadership Management) and PBF (Performance & Behavior Feedback)
evaluation processes.
(3) Includes initiatives undertaken by the Group worldwide in support of local communities. Calculation based on London Benchmarking Group
(LBG) method.