Chrysler 2014 Annual Report Download - page 50
Download and view the complete annual report
Please find page 50 of the 2014 Chrysler annual report below. You can navigate through the pages in the report by either clicking on the pages listed below, or by using the keyword search tool below to find specific information within the annual report.-
 1
1 -
2
-
3
-
4
-
5
-
6
-
7
-
8
-
9
-
10
-
11
-
12
-
13
-
14
-
15
-
16
-
17
-
18
-
19
-
20
-
21
-
22
-
23
-
24
-
25
-
26
-
27
-
28
-
29
-
30
-
31
-
32
-
33
-
34
-
35
-
36
-
37
-
38
-
39
-
 40
40 -
 41
41 -
 42
42 -
 43
43 -
 44
44 -
 45
45 -
 46
46 -
 47
47 -
 48
48 -
 49
49 -
 50
50 -
 51
51 -
 52
52 -
 53
53 -
 54
54 -
 55
55 -
 56
56 -
 57
57 -
 58
58 -
 59
59 -
 60
60 -
61
-
62
-
63
-
64
-
65
-
66
-
67
-
68
-
69
-
70
-
71
-
72
-
73
-
74
-
75
-
76
-
77
-
78
-
79
-
80
-
81
-
82
-
83
-
84
-
85
-
86
-
87
-
88
-
89
-
90
-
91
-
92
-
93
-
94
-
95
-
96
-
97
-
98
-
99
-
100
-
101
-
102
-
103
-
104
-
105
-
106
-
107
-
108
-
109
-
110
-
111
-
112
-
113
-
114
-
115
-
116
-
117
-
118
-
119
-
120
-
121
-
122
-
123
-
124
-
125
-
126
-
127
-
128
-
129
-
130
-
131
-
132
-
133
-
134
-
135
-
136
-
137
-
138
-
139
-
140
-
141
-
142
-
143
-
144
-
145
-
146
-
147
-
148
-
149
-
150
-
151
-
152
-
153
-
154
-
155
-
156
-
157
-
158
-
159
-
160
-
161
-
162
-
163
-
164
-
165
-
166
-
167
-
168
-
169
-
170
-
171
-
172
-
173
-
174
-
175
-
176
-
177
-
178
-
179
-
180
-
181
-
182
-
183
-
184
-
185
-
186
-
187
-
188
-
189
-
190
-
191
-
192
-
193
-
194
-
195
-
196
-
197
-
198
-
199
-
200
-
201
-
202
-
203
-
204
-
205
-
206
-
207
-
208
-
209
-
210
-
211
-
212
-
213
-
214
-
215
-
216
-
217
-
218
-
219
-
220
-
221
-
222
-
223
-
224
-
225
-
226
-
227
-
228
-
229
-
230
-
231
-
232
-
233
-
234
-
235
-
236
-
237
-
238
-
239
-
240
-
241
-
242
-
243
-
244
-
245
-
246
-
247
-
248
-
249
-
250
-
251
-
252
-
253
-
254
-
255
-
256
-
257
-
258
-
259
-
260
-
261
-
262
-
263
-
264
-
265
-
266
-
267
-
268
-
269
-
270
-
271
-
272
-
273
-
274
-
275
-
276
-
277
-
278
-
279
-
280
-
281
-
282
-
283
-
284
-
285
-
286
-
287
-
288
-
289
-
290
-
291
-
292
-
293
-
294
-
295
-
296
-
297
-
298
-
299
-
300
-
301
-
302
-
303
 |
 |

48 2014 | ANNUAL REPORT
Overview of Our Business
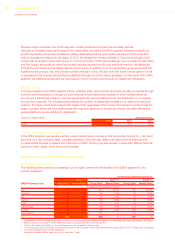
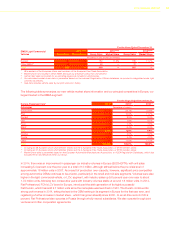
The following table presents our mass-market vehicle market share information and our principal competitors in Brazil,
our largest market in the LATAM segment:
For the Years Ended December 31,
Brazil 2014(1) 2013(1) 2012(1)
Automaker Percentage of industry
FCA 21.2% 21.5% 23.3%
Volkswagen(*) 17.7% 18.8% 21.2%
GM 17.4% 18.1% 17.7%
Ford 9.2% 9.4% 8.9%
Other 34.5% 32.2% 28.9%
Total 100.0% 100.0% 100.0%
(1) Our estimated market share data presented are based on management’s estimates of industry sales data, which use certain data provided
by third-party sources, including IHS Global Insight, National Organization of Automotive Vehicles Distribution and Association of Automotive
Producers.
(*) Including Audi.
The LATAM segment automotive industry decreased 12.5 percent from 2013, to 5.2 million vehicles (cars and light
commercial vehicles) in 2014. The decrease was mainly due to Brazil and Argentina with 6.9 percent and 28.7 percent
decreases, respectively. Over the past four years industry sales in the LATAM segment grew by 1.4 percent, mainly
due to Argentina and Other countries while Brazilian market remained substantially stable driven by economic factors
such as greater development of gross domestic product, increased access to credit facilities and incentives adopted
by Brazil in 2009 and 2012.
Our vehicle sales in the LATAM segment leverage the name recognition of Fiat and the relatively urban population
of countries like Brazil to offer Fiat brand mini and small vehicles in our key markets in the LATAM segment. We are
the leading automaker in Brazil, due in large part to our market leadership in the mini and small segments (which
represent almost 60 percent of Brazilian market vehicle sales). Fiat also leads the pickup truck market in Brazil (with
the Fiat Strada, 56.2 percent of segment share), although this segment is small as a percentage of total industry and
compared to other countries in the LATAM segment.
In Brazil, the automotive industry benefited from tax incentives in 2012, which helped our strong performance in that
year as we were able to leverage our operational flexibility in responding to the sharp increase in market demand.
However, tax incentives have limited the ability of OEMs to recover cost increases associated with inflation by
increasing prices, a problem that has been exacerbated by the weakening of the Brazilian Real. Increasing competition
over the past several years has further reduced our overall profitability in the region. Import restrictions in Brazil have
also limited our ability to bring new vehicles to Brazil. We plan to start production in our new assembly plant in Brazil in
2015, which we believe will enhance our ability to introduce new locally-manufactured vehicles that are not subject to
such restrictions.
LATAM Distribution
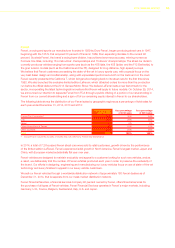
The following table presents the number of independent entities in our dealer and distributor network. In the LATAM
segment, we generally enter into multiple dealer agreements with a single dealer, covering one or more points of sale.
Outside Brazil and Argentina, our major markets, we distribute our vehicles mainly through general distributors and
their dealer networks. This table counts each independent dealer entity, regardless of the number of contracts or
points of sale the dealer operates. Where we have relationships with a general distributor in a particular market, this
table reflects that general distributor as one distribution relationship:
Distribution Relationships At December 31,
2014 2013 2012
LATAM 441 450 436