Chrysler 2006 Annual Report Download - page 92
Download and view the complete annual report
Please find page 92 of the 2006 Chrysler annual report below. You can navigate through the pages in the report by either clicking on the pages listed below, or by using the keyword search tool below to find specific information within the annual report.-
 1
1 -
2
-
3
-
4
-
5
-
6
-
7
-
8
-
9
-
10
-
11
-
12
-
13
-
14
-
15
-
16
-
17
-
18
-
19
-
20
-
21
-
22
-
23
-
24
-
25
-
26
-
27
-
28
-
29
-
30
-
31
-
32
-
33
-
34
-
35
-
36
-
37
-
38
-
39
-
40
-
41
-
42
-
43
-
44
-
45
-
46
-
47
-
48
-
49
-
50
-
51
-
52
-
53
-
54
-
55
-
56
-
57
-
58
-
59
-
60
-
61
-
62
-
63
-
64
-
65
-
66
-
67
-
68
-
69
-
70
-
71
-
72
-
73
-
74
-
75
-
76
-
77
-
78
-
79
-
80
-
81
-
 82
82 -
 83
83 -
 84
84 -
 85
85 -
 86
86 -
 87
87 -
 88
88 -
 89
89 -
 90
90 -
 91
91 -
 92
92 -
 93
93 -
 94
94 -
 95
95 -
 96
96 -
 97
97 -
 98
98 -
 99
99 -
 100
100 -
 101
101 -
 102
102 -
103
-
104
-
105
-
106
-
107
-
108
-
109
-
110
-
111
-
112
-
113
-
114
-
115
-
116
-
117
-
118
-
119
-
120
-
121
-
122
-
123
-
124
-
125
-
126
-
127
-
128
-
129
-
130
-
131
-
132
-
133
-
134
-
135
-
136
-
137
-
138
-
139
-
140
-
141
-
142
-
143
-
144
-
145
-
146
-
147
-
148
-
149
-
150
-
151
-
152
-
153
-
154
-
155
-
156
-
157
-
158
-
159
-
160
-
161
-
162
-
163
-
164
-
165
-
166
-
167
-
168
-
169
-
170
-
171
-
172
-
173
-
174
 |
 |

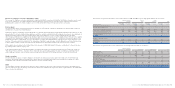
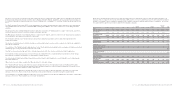
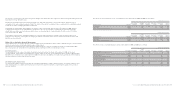
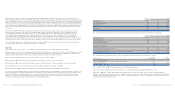
Geographical segment information
The following geographical segment information on Net Revenues is based on the geographical location of the Group’s customers:
(in millions of euros) 2006 2005
Italy 14,851 13,078
Europe (Italy excluded) 20,298 18,518
North America 6,315 6,048
Mercosur 5,416 4,364
Other areas 4,952 4,536
Net revenues of the Group 51,832 46,544
The total amount of assets and capital expenditure by geographical segment are as follows:
At December 31, 2006 At December 31, 2005
(in millions of euros) Assets Capital expenditure Assets Capital expenditure
Italy 24,351 2,534 24,737 2,075
Europe (Italy excluded) 12,918 1,110 15,908 1,011
North America 13,396 321 15,599 165
Mercosur 5,581 299 4,085 164
Other areas 2,057 48 2,125 105
Total 58,303 4,312 62,454 3,520
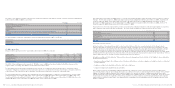
34. Information on financial risks
The Group is exposed to the following financial risks connected with its operations:
■credit risk, regarding its normal business relations with customers and dealers, and its financing activities;
■liquidity risk, with particular reference to the availability of funds and access to the credit market and to financial instruments
in general;
■market risk (principally relating to exchange rates, interest rates), since the Group operates at an international level in different
currencies and uses financial instruments which generate interest. The Group is also exposed to the risk of changes in the price
of certain listed shares.
As described in the section “Risk management”, the Fiat Group constantly monitors the financial risks to which it is exposed,
in order to detect those risks in advance and take the necessary action to mitigate them.
The following section provides qualitative and quantitative disclosures on the effect that these risks may have upon the Group.
The quantitative data reported in the following do not have any value of a prospective nature, in particular the sensitivity analysis
on market risks is unable to reflect the complexity of the market and its related reaction which may result from every change which
may occur.
Fiat Group Consolidated Financial Statements at December 31, 2006 -Notes 181
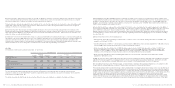
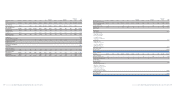
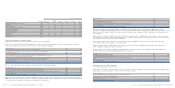
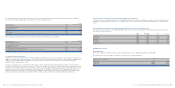
Other and
Magneti Business elimina- FIAT
(in millions of euros) Fiat Auto Maserati Ferrari CNH Iveco FPT Marelli Teksid Comau Solutions Itedi tions Group
At December 31, 2005
Sector operating assets 16,226 235 936 17,828 6,033 4,220 2,363 671 1,091 228 186 534 50,551
Sector operating
assets held-for-sale 5 – – 32 – – – – – 113 – – 150
Investments 1,780 1 3 385 487 17 13 13 5 1 12 (627) 2,090
Unallocated
Group assets:
- Tax assets 2,882
-Receivables from
financing activities,
Non-current Other
receivables and
Securities of industrial
companies 632
- Cash and cash
equivalents, Current
securities and Other
financial assets of
industrial companies 6,149
Total unallocated
Group assets 9,663
Total assets 62,454
Sector operating
liabilities: 15,638 270 625 14,483 5,591 2,258 1,620 419 828 327 161 338 42,558
Sector operating
liabilities held-for-sale – – – – – – – – – 110 – – 110
Provision for investments 21 –––4332–2–––71
Unallocated
Group liabilities:
-Tax liabilities 934
-Debt and Other financial
liabilities of
industrial companies 9,368
Total unallocated
Group liabilities 10,302
Total liabilities 53,041
Fiat Group Consolidated Financial Statements at December 31, 2006 -Notes 180