Chrysler 2006 Annual Report Download - page 61
Download and view the complete annual report
Please find page 61 of the 2006 Chrysler annual report below. You can navigate through the pages in the report by either clicking on the pages listed below, or by using the keyword search tool below to find specific information within the annual report.-
 1
1 -
2
-
3
-
4
-
5
-
6
-
7
-
8
-
9
-
10
-
11
-
12
-
13
-
14
-
15
-
16
-
17
-
18
-
19
-
20
-
21
-
22
-
23
-
24
-
25
-
26
-
27
-
28
-
29
-
30
-
31
-
32
-
33
-
34
-
35
-
36
-
37
-
38
-
39
-
40
-
41
-
42
-
43
-
44
-
45
-
46
-
47
-
48
-
49
-
50
-
 51
51 -
 52
52 -
 53
53 -
 54
54 -
 55
55 -
 56
56 -
 57
57 -
 58
58 -
 59
59 -
 60
60 -
 61
61 -
 62
62 -
 63
63 -
 64
64 -
 65
65 -
 66
66 -
 67
67 -
 68
68 -
 69
69 -
 70
70 -
 71
71 -
72
-
73
-
74
-
75
-
76
-
77
-
78
-
79
-
80
-
81
-
82
-
83
-
84
-
85
-
86
-
87
-
88
-
89
-
90
-
91
-
92
-
93
-
94
-
95
-
96
-
97
-
98
-
99
-
100
-
101
-
102
-
103
-
104
-
105
-
106
-
107
-
108
-
109
-
110
-
111
-
112
-
113
-
114
-
115
-
116
-
117
-
118
-
119
-
120
-
121
-
122
-
123
-
124
-
125
-
126
-
127
-
128
-
129
-
130
-
131
-
132
-
133
-
134
-
135
-
136
-
137
-
138
-
139
-
140
-
141
-
142
-
143
-
144
-
145
-
146
-
147
-
148
-
149
-
150
-
151
-
152
-
153
-
154
-
155
-
156
-
157
-
158
-
159
-
160
-
161
-
162
-
163
-
164
-
165
-
166
-
167
-
168
-
169
-
170
-
171
-
172
-
173
-
174
 |
 |

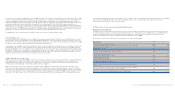
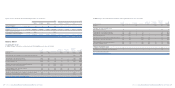
Fiat Group Consolidated Financial Statements at December 31, 2006 -Notes 119
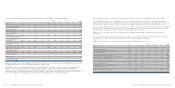
2006 2005
Ordinary Preference Saving Ordinary Preference Saving
shares shares shares Total shares shares shares Total
Profit attributable to equity holders
of the parent million of euros 1,065 1,331
Prior period dividends to saving
shares declared for the period million of euros – –5050 ––––
Dividends declared for the period million of euros 169 32 25 226 ––––
Theoretical preference right on saving
and ordinary shares million of euros 169 – 12 181 ––––
Profit available for distribution
to all classes of shares million of euros 521 49 38 608 1,102 129 100 1,331
Profit attributable to
each class of shares million of euros 859 81 125 1,065 1,102 129 100 1,331
Weighted average
number of shares thousand 1,088,027 103,292 79,913 1,271,232 881,177 103,292 79,913 1,064,382
Basic Earning per share euros 0.789 0.789 1.564 1.250 1.250 1.250
If prior period dividends to saving shares had not been assigned, basic and diluted earnings per savings shares in 2006 would have
been 0.983 euros per share 0.982 euros per share, respectively. Basic and diluted earnings per share attributable to ordinary and
preference shares in 2006 would have been 0.828 euros per share and 0.827 euros per share, respectively.
For the purpose of calculating the diluted earning per share in 2006, the number of ordinary shares considered is the average
number of shares outstanding plus the effects arising from shares that would be issued on the exercise of all dilutive stock
options.
During 2005 no dilutive effects arose from above mentioned stock option plans.
In 2005 and 2006 no dilutive effects arose from warrants issued by Fiat S.p.A. on its ordinary shares.
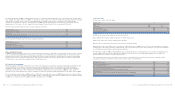
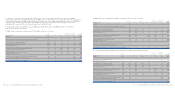
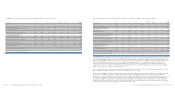
Year of expiry
Total at
December Beyond Unlimited/
(in millions of euros) 31, 2006 2007 2008 2009 2010 2010 indeterminable
Temporary differences and tax losses relating
to State taxation (IRES in the case of Italy):
- Deductible temporary differences 10,445 4,723 1,281 1,210 1,159 2,010 62
- Taxable temporary differences (6,347) (1,330) (1,164) (1,240) (1,072) (1,290) (251)
- Tax losses 18,461 551 1,978 2,016 2,134 4,804 6,978
- Temporary differences and tax losses for which
deferred tax assets have not been recognised (17,574) (1,384) (1,980) (1,916) (2,130) (4,942) (5,222)
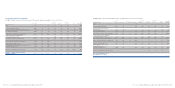
Temporary differences and tax losses relating to State taxation 4,985 2,560 115 70 91 582 1,567
Temporary differences and tax losses relating
to local taxation (IRAP in the case of Italy):
- Deductible temporary differences 4,025 1,013 684 656 620 1,039 13
- Taxable temporary differences (4,239) (516) (936) (1,013) (850) (924) –
- Tax losses 822 – – – – 246 576
- Temporary differences and tax losses for which
deferred tax assets have not been recognised (1,390) (163) (81) (81) (79) (419) (567)
Temporary differences and tax losses relating to local taxation (782) 334 (333) (438) (309) (58) 22
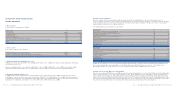
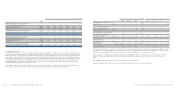
12. Earnings per share
As explained at the Note 25 below, Fiat S.p.A. capital stock is represented by three different classes of shares (ordinary shares,
preference shares and saving shares) that participate in dividends with different rights. Profit or loss of the period attributable to
each class of share is determined in accordance with the share’s contractual dividend rights, and for this purpose the net result
attributable to ordinary equity holders of the parent entity is adjusted by the amount of the dividend declared in the period for
each class of share and by any other dividends that are contractually due, in the theoretical event of a total distribution of profits.
The remaining profit is then allocated equally to each of the three classes of shares as if all the profit for the period had been
distributed, with the total amount of profit allocated to each class of share being divided by the weighted average number of
outstanding shares to determine earnings per share.
The following table shows the reconciliation between the net result attributable to equity holders of the parent and the profit
attributable to each class of shares, as well as, figures used in the computation of the base earnings per share:
Fiat Group Consolidated Financial Statements at December 31, 2006 -Notes 118