Chrysler 2006 Annual Report Download - page 8
Download and view the complete annual report
Please find page 8 of the 2006 Chrysler annual report below. You can navigate through the pages in the report by either clicking on the pages listed below, or by using the keyword search tool below to find specific information within the annual report.-
 1
1 -
 2
2 -
 3
3 -
 4
4 -
 5
5 -
 6
6 -
 7
7 -
 8
8 -
 9
9 -
 10
10 -
 11
11 -
 12
12 -
 13
13 -
 14
14 -
 15
15 -
 16
16 -
 17
17 -
 18
18 -
 19
19 -
20
-
21
-
22
-
23
-
24
-
25
-
26
-
27
-
28
-
29
-
30
-
31
-
32
-
33
-
34
-
35
-
36
-
37
-
38
-
39
-
40
-
41
-
42
-
43
-
44
-
45
-
46
-
47
-
48
-
49
-
50
-
51
-
52
-
53
-
54
-
55
-
56
-
57
-
58
-
59
-
60
-
61
-
62
-
63
-
64
-
65
-
66
-
67
-
68
-
69
-
70
-
71
-
72
-
73
-
74
-
75
-
76
-
77
-
78
-
79
-
80
-
81
-
82
-
83
-
84
-
85
-
86
-
87
-
88
-
89
-
90
-
91
-
92
-
93
-
94
-
95
-
96
-
97
-
98
-
99
-
100
-
101
-
102
-
103
-
104
-
105
-
106
-
107
-
108
-
109
-
110
-
111
-
112
-
113
-
114
-
115
-
116
-
117
-
118
-
119
-
120
-
121
-
122
-
123
-
124
-
125
-
126
-
127
-
128
-
129
-
130
-
131
-
132
-
133
-
134
-
135
-
136
-
137
-
138
-
139
-
140
-
141
-
142
-
143
-
144
-
145
-
146
-
147
-
148
-
149
-
150
-
151
-
152
-
153
-
154
-
155
-
156
-
157
-
158
-
159
-
160
-
161
-
162
-
163
-
164
-
165
-
166
-
167
-
168
-
169
-
170
-
171
-
172
-
173
-
174
 |
 |

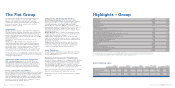
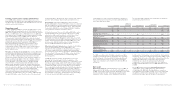
Net revenues Trading profit Operating result Total operating assets
(in millions of euros) 2006 2005 2006 2005 2006 2005 2006 2005
Fiat Auto 23,702 19,533 291 (281) 727 (818) 12,948 16,231
Maserati 519 533 (33) (85) (33) (85) 300 235
Ferrari 1,447 1,289 183 157 183 157 918 936
Agricultural and Construction Equipment (CNH) 10,527 10,212 737 698 592 611 17,756 17,860
Trucks and Commercial Vehicles (Iveco) (1) 9,136 8,483 546 332 565 212 6,131 6,033
Fiat Powertrain Technologies (1) 6,145 4,520 168 109 102 81 4,103 4,220
Components (Magneti Marelli) 4,455 4,033 190 162 175 127 2,294 2,363
Metallurgical Products (Teksid) 979 1,036 56 45 26 27 616 671
Production Systems (Comau) 1,280 1,573 (66) 42 (272) (8) 933 1,091
Services (Business Solutions) 668 752 37 35 28 7228 341
Publishing and Communications (Itedi) 401 397 11 16 12 13 243 186
Holding companies, Other companies and Eliminations (7,427) (5,817) (169) (230) (44) 1,891 (582) 534
Total for the Group 51,832 46,544 1,951 1,000 2,061 2,215 45,888 50,701
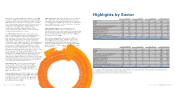
Total operating liabilities Investments (*) R&D expenses (**) Number of employees
(in millions of euros) 2006 2005 2006 2005 2006 2005 2006 2005
Fiat Auto 12,446 15,638 2,163 1,582 675 665 44,691 46,099
Maserati 367 270 82 20 46 57 649 606
Ferrari 634 625 142 142 83 86 2,870 2,809
Agricultural and Construction Equipment (CNH) 14,653 14,483 394 255 289 234 25,335 25,420
Trucks and Commercial Vehicles (Iveco) (1) 5,784 5,591 342 321 174 211 24,533 24,323
Fiat Powertrain Technologies (1) 2,444 2,258 254 296 74 68 18,924 18,161
Components (Magneti Marelli) 1,625 1,620 293 313 217 197 25,195 24,213
Metallurgical Products (Teksid) 365 419 32 45 558,342 8,952
Production Systems (Comau) 712 828 56 38 20 20 12,293 12,725
Services (Business Solutions) 360 437 10 19 ––5,057 5,436
Publishing and Communications (Itedi) 188 161 45 20 ––836 846
Holding companies, Other companies and Eliminations (1,227) 338 (24) 115 15 3,287 4,105
Total for the Group 38,351 42,668 3,789 3,052 1,598 1,558 172,012 173,695
(1) Since January 1, 2006 Fiat Powertrain Technologies (FPT) perimeter comprises the passenger vehicles engine and transmission activities – over which Fiat regained control and started to
consolidate in May 2005 following termination of the Master Agreement with General Motors – as well as the industrial powertrain activities that were included in the Iveco perimeter until
December 31, 2005. The relevant 2005 figures have been reclassified accordingly.
(*) Investments in tangible and intangible assets (net of vehicles sold with buy-back commitments).
(**) Including capitalised R&D costs and costs charged directly to operations during the fiscal year.
■Fiat Group recorded revenues of 51.8 billion euros in 2006,
up 11.4% from 2005. The improvement was largely attributable
to Fiat Auto, whose revenues rose by 21.3%, and Iveco, up 7.7%.
CNH reported a 3.1% increase in revenues (+2.4% excluding
the foreign exchange translation impact). Revenues also rose
at the Components & Production Systems Business Area:
+11.0% (on a comparable basis) at Fiat Powertrain
Technologies and +10.5% at Magneti Marelli. Comau
revenues were down 18.6% reflecting a severe slowdown
in industry-wide demand for its services.
■In 2006 trading profit amounted to 1,951 million euros
(3.8% of revenues), nearly doubling the 1,000 million euros
level recorded in 2005 (2.1% of revenues). Significant
improvements were achieved in the Automobiles Business
Area, particularly at Fiat Auto, which reported a full year
trading profit of 291 million euros, against a trading loss
of 281 million euros in 2005, and by Iveco, whose trading profit
rose from 332 million euros to 546 million euros. CNH posted
a 5.6% increase in trading profit, from 698 million euros to
737 million euros (excluding the difference in the one-time
impact from a reduction in health-care costs, the year-over-
year improvement would have been 97 million euros or 15.8%).
The Components & Production Systems Business Area
reported slightly lower trading profit (348 million euros versus
358 million euros in 2005) reflecting a sharp drop at Comau,
currently in a restructuring process, only partly offset by
improvements at Magneti Marelli, Fiat Powertrain Technologies
and Teksid. Excluding Comau, trading profit of the Components
&Production Systems Business Area increased by 98 million
euros, delivering a trading margin of 3.7%.
■Operating result for the year totalled 2,061 million
euros, compared with 2,215 million euros in 2005.
The 154-million-euro decrease reflects higher trading
profit of 951 million euros and lower net unusual
income of 1,105 million euros (2006: 110 million euros,
2005: 1,215 million euros).
■Income before taxes totalled 1,641 million euros in 2006,
compared with 2,264 million euros in 2005. Net of changes
in unusual items (including the 858 million euro unusual
financial income on the conversion of the Mandatory
Convertible Facility), income before taxes improved
by 1,340 million euros in 2006.
Report on Operations Highlights by Sector 13
Highlights by Sector
Report on Operations Highlights – Group12
■Net result for the year was 1,151 million euros, compared
with 1,420 million euros in 2005. Excluding the impact of
net unusual items, the Group would have posted a net loss
of 376 million euros in 2005 and a net income of 1,041 million
euros in 2006. Therefore, on a like-for-like basis, net income
improved by 1,417 million euros.
■Net industrial debt decreased during the year by
approximately 1.4 billion euros to 1.8 billion euros,
reflecting positive business performance and notwithstanding
the re-acquisition of 29% of Ferrari for 919 million euros. The
ratio of net industrial debt to equity at the end of 2006 was
0.18 (0.34 at the end of 2005).
■The Group’s cash position at December 31, 2006 was
approximately 8.0 billion euros, (7.0 billion euros at the
end of 2005) largely impacted by the over 3 billion euros
deriving from the closing of the joint venture between
Fiat Auto and Crédit Agricole at the end of December 2006,
partly offset by the utilisation of cash to reduce gross debt
during the year.