Chrysler 2006 Annual Report Download - page 67
Download and view the complete annual report
Please find page 67 of the 2006 Chrysler annual report below. You can navigate through the pages in the report by either clicking on the pages listed below, or by using the keyword search tool below to find specific information within the annual report.-
 1
1 -
2
-
3
-
4
-
5
-
6
-
7
-
8
-
9
-
10
-
11
-
12
-
13
-
14
-
15
-
16
-
17
-
18
-
19
-
20
-
21
-
22
-
23
-
24
-
25
-
26
-
27
-
28
-
29
-
30
-
31
-
32
-
33
-
34
-
35
-
36
-
37
-
38
-
39
-
40
-
41
-
42
-
43
-
44
-
45
-
46
-
47
-
48
-
49
-
50
-
51
-
52
-
53
-
54
-
55
-
56
-
 57
57 -
 58
58 -
 59
59 -
 60
60 -
 61
61 -
 62
62 -
 63
63 -
 64
64 -
 65
65 -
 66
66 -
 67
67 -
 68
68 -
 69
69 -
 70
70 -
 71
71 -
 72
72 -
 73
73 -
 74
74 -
 75
75 -
 76
76 -
 77
77 -
78
-
79
-
80
-
81
-
82
-
83
-
84
-
85
-
86
-
87
-
88
-
89
-
90
-
91
-
92
-
93
-
94
-
95
-
96
-
97
-
98
-
99
-
100
-
101
-
102
-
103
-
104
-
105
-
106
-
107
-
108
-
109
-
110
-
111
-
112
-
113
-
114
-
115
-
116
-
117
-
118
-
119
-
120
-
121
-
122
-
123
-
124
-
125
-
126
-
127
-
128
-
129
-
130
-
131
-
132
-
133
-
134
-
135
-
136
-
137
-
138
-
139
-
140
-
141
-
142
-
143
-
144
-
145
-
146
-
147
-
148
-
149
-
150
-
151
-
152
-
153
-
154
-
155
-
156
-
157
-
158
-
159
-
160
-
161
-
162
-
163
-
164
-
165
-
166
-
167
-
168
-
169
-
170
-
171
-
172
-
173
-
174
 |
 |

Fiat Group Consolidated Financial Statements at December 31, 2006 -Notes 131
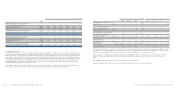
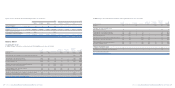
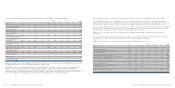
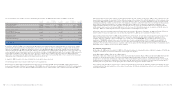
The net carrying amount of Property, plant and equipment at December 31, 2005 can be analysed as follows:
At Change in At
December Impairment the scope of Translation Other December
(in millions of euros) 31, 2004 Additions Depreciation losses Divestitures consolidation differences changes 31, 2005
Land 493 1 – – (25) 26 24 7 526
-Owned industrial buildings 2,157 76 (133) (30) (39) 79 104 16 2,230
-Industrial buildings leased under
finance leases 43 – (3) – – – – 23 63
Total Industrial buildings 2,200 76 (136) (30) (39) 79 104 39 2,293
-Owned plant, machinery and equipment 4,543 1,148 (1,435) (59) (31) 1,088 229 465 5,948
-Plant, machinery and equipment
leased under finance leases 18 7(4) –––3125
Total Plant, machinery and equipment 4,561 1,155 (1,439) (59) (31) 1,088 232 466 5,973
Assets sold with a buy-back commitment 1,106 468 (150) (24) (232) – 5 3 1,176
-Owned other tangible assets 402 170 (137) – (80) 16 28 25 424
-Other tangible assets leased
under finance leases 4 5 (2) – – – – 1 8
Total Other tangible assets 406 175 (139) – (80) 16 28 26 432
Advances and tangible assets in progress 671 400 (2) – – 49 29 (541) 606
Total net carrying amount of Property,
plant and equipment 9,437 2,275 (1,866) (113) (407) 1,258 422 – 11,006
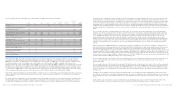
In 2005, the Group had written down certain industrial buildings during the year whose carrying amount was considered not to be
fully recoverable either through use or by a possible sale. This write-down is included in Selling, general and administrative costs.
Moreover, during 2005, the Group reviewed the recoverable amount of certain production plant in view of its reorganisation and
restructuring programmes for specific Sectors. In addition, the Group carried out a recoverability assessment for assets of
businesses for which there were indications that impairment may have occurred, using discounted cash flow methods. These
assessments led to the recognition of impairment losses of 59 million euros, of which 12 million euros is recognised in Trading
profit and 47 million euros in the item Restructuring costs.
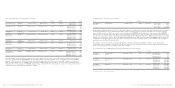
The recoverable amount of these assets was determined with reference to their value in use, calculated using a pre-tax discount
rate varying between 9.5% and 18%, as a function of the different business risks.
At December 31, 2005, the amount of 1,258 million euros shown as a Change in the scope of consolidation arose mainly from the
line-by-line consolidation of the Powertrain activities, previously part of Fiat-GM Powertrain (the joint venture with General
Motors), net of the reclassification to assets held for sale of certain plant and machinery of the subsidiary Atlanet S.p.A., for which
asales agreement had been signed with the British Telecom group, approved by the antitrust authorities in February 2006. At
December 31, 2005, the column also included an amount of 32 million euros relating to the reclassification of certain properties
and industrial buildings of CNH, no longer in use, to Assets held for sale, as the consequence of the restructuring process taking
place over the past few years following the acquisition of the Case group.
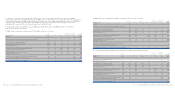
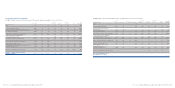
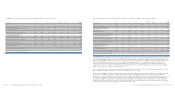
In 2005 Changes in accumulated depreciation and impairment losses were as follows:
At Change in At
December Impairment the scope of Translation Other December
(in millions of euros) 31, 2004 Depreciation losses Divestitures consolidation differences changes 31, 2005
Land 7––––––7
-Owned industrial buildings 1,931 133 30 (104) 14 85 33 2,122
-Industrial buildings leased under finance leases 5 3 – – – – 2 10
Total Industrial buildings 1,936 136 30 (104) 14 85 35 2,132
-Owned plant, machinery and equipment 14,576 1,435 59 (1,050) 2,751 482 12 18,265
-Plant, machinery and equipment
leased under finance leases 11 4 – – – 1 12 28
Total Plant, machinery and equipment 14,587 1,439 59 (1,050) 2,751 483 24 18,293
Assets sold with a buy-back commitment 389 150 24 (164) – 2 5 406
-Owned other tangible assets 1,410 137 – (107) 65 51 (26) 1,530
-Other tangible assets leased under finance leases 1 2 – – – –14
Total Other tangible assets 1,411 139 – (107) 65 51 (25) 1,534
Advances and tangible assets in progress 6 2 – – – 1 – 9
Total accumulated depreciation and impairment
of Property, plant and equipment 18,336 1,866 113 (1,425) 2,830 622 39 22,381
Fiat Group Consolidated Financial Statements at December 31, 2006 -Notes 130