Chrysler 2006 Annual Report Download - page 123
Download and view the complete annual report
Please find page 123 of the 2006 Chrysler annual report below. You can navigate through the pages in the report by either clicking on the pages listed below, or by using the keyword search tool below to find specific information within the annual report.-
 1
1 -
2
-
3
-
4
-
5
-
6
-
7
-
8
-
9
-
10
-
11
-
12
-
13
-
14
-
15
-
16
-
17
-
18
-
19
-
20
-
21
-
22
-
23
-
24
-
25
-
26
-
27
-
28
-
29
-
30
-
31
-
32
-
33
-
34
-
35
-
36
-
37
-
38
-
39
-
40
-
41
-
42
-
43
-
44
-
45
-
46
-
47
-
48
-
49
-
50
-
51
-
52
-
53
-
54
-
55
-
56
-
57
-
58
-
59
-
60
-
61
-
62
-
63
-
64
-
65
-
66
-
67
-
68
-
69
-
70
-
71
-
72
-
73
-
74
-
75
-
76
-
77
-
78
-
79
-
80
-
81
-
82
-
83
-
84
-
85
-
86
-
87
-
88
-
89
-
90
-
91
-
92
-
93
-
94
-
95
-
96
-
97
-
98
-
99
-
100
-
101
-
102
-
103
-
104
-
105
-
106
-
107
-
108
-
109
-
110
-
111
-
112
-
 113
113 -
 114
114 -
 115
115 -
 116
116 -
 117
117 -
 118
118 -
 119
119 -
 120
120 -
 121
121 -
 122
122 -
 123
123 -
 124
124 -
 125
125 -
 126
126 -
 127
127 -
 128
128 -
 129
129 -
 130
130 -
 131
131 -
 132
132 -
 133
133 -
134
-
135
-
136
-
137
-
138
-
139
-
140
-
141
-
142
-
143
-
144
-
145
-
146
-
147
-
148
-
149
-
150
-
151
-
152
-
153
-
154
-
155
-
156
-
157
-
158
-
159
-
160
-
161
-
162
-
163
-
164
-
165
-
166
-
167
-
168
-
169
-
170
-
171
-
172
-
173
-
174
 |
 |

Fiat S.p.A. Financial Statements at December 31, 2006 243Fiat S.p.A. Financial Statements at December 31, 2006242
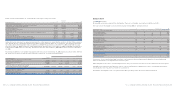
Balance Sheet
pursuant to Consob Resolution No. 15519 of July 27, 2006
of which
At December 31, Related parties At December 31, of which
(in thousands of euros) Note 2006 (Note 30) 2005 Related parties
ASSETS
Non-current assets
Intangible assets (11) 772 676
Property, plant and equipment (12) 37,253 39,658
Investments (13) 14,499,595 5,117,532
Other financial assets (14) 20,134 10,029 5,335 5,262
Other non-current assets (15) 1,573 4,502
Deferred tax assets (10) ––
Total Non-current assets 14,559,327 5,167,703
Current assets
Inventories (27) ––
Trade receivables (16) 154,692 2,408 215,652 7,687
Current financial receivables (17) 84,173 84,173 3,075,894 3,075,894
Other current receivables (18) 626,429 146,908 799,920 106,007
Cash and cash equivalents (19) 608 495
Total Current assets 865,902 4,091,961
Assets held for sale ––
TOTAL ASSETS 15,425,229 9,259,664
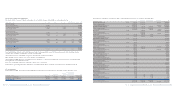
STOCKHOLDERS’ EQUITY AND LIABILITIES
Stockholders’ equity (20)
Capital stock 6,377,257 6,377,257
Additional paid-in capital 1,540,856 681,856
Reserve under law no. 413/1991 22,591 22,591
Legal reserve 446,562 446,562
Reserve for treasury stock in portfolio 24,139 27,710
Extraordinary reserve 6,135 335
Retained earnings (losses) (553,412) (811,737)
Treasury stock (24,139) (27,710)
Gains (losses) recognised directly in equity 162,765 134,267
Stock option reserve 27,400 16,103
Net result 2,343,375 1,117,325
Total Stockholders’ equity 10,373,529 7,984,559
Non-current liabilities
Provisions for employee benefits and other non-current provisions (21) 18,104 29,171
Non-current financial payables (22) 2,810,029 2,810,029 5,262 5,262
Other non-current liabilities (23) 20,001 – 16,861 2,622
Deferred tax liabilities (10) 3,438 –
Total Non-current liabilities 2,851,572 51,294
Current liabilities
Provisions for employee benefits and other current provisions (24) 26,791 30,991
Trade payables (25) 184,661 17,801 385,182 4,975
Current financial payables (26) 1,627,430 1,405,554 557,383 434
Other payables (27) 361,246 319,078 250,255 215,379
Total Current liabilities 2,200,128 1,223,811
Liabilities held for sale ––
TOTAL STOCKHOLDERS’ EQUITY AND LIABILITIES 15,425,229 9,259,664
Income Statement
pursuant to Consob Resolution No. 15519 of July 27, 2006
of which
Related parties of which
(in thousands of euros) Note 2006 (Note 30) 2005 Related parties
Dividends and other income from investments (1) 362,419 7,714
(Impairment losses) reversal of impairment losses of investments (2) 2,099,350 (430,789)
Gains (losses) on the disposal of investments (3) 425 (1,300)
Other operating income (4) 79,238 33,200 72,854 24,256
Personnel costs (5) (57,900) (60,027)
Other operating costs (6) (141,006) (51,901) (121,360) (54,477)
Income (expenses) from significant non-recurring transactions (7) –1,133,110
Financial income (expenses) (8) (24,847) (17,765) (61,685) 106,259
Financial income from significant non-recurring transactions (9) –857,636
Result before taxes 2,317,679 1,396,153
Income taxes (10) (25,696) 278,828
Result from continuing operations 2,343,375 1,117,325
Result from discontinued operations ––
Net result 2,343,375 1,117,325