Chrysler 2006 Annual Report Download - page 22
Download and view the complete annual report
Please find page 22 of the 2006 Chrysler annual report below. You can navigate through the pages in the report by either clicking on the pages listed below, or by using the keyword search tool below to find specific information within the annual report.-
 1
1 -
2
-
3
-
4
-
5
-
6
-
7
-
8
-
9
-
10
-
11
-
 12
12 -
 13
13 -
 14
14 -
 15
15 -
 16
16 -
 17
17 -
 18
18 -
 19
19 -
 20
20 -
 21
21 -
 22
22 -
 23
23 -
 24
24 -
 25
25 -
 26
26 -
 27
27 -
 28
28 -
 29
29 -
 30
30 -
 31
31 -
 32
32 -
33
-
34
-
35
-
36
-
37
-
38
-
39
-
40
-
41
-
42
-
43
-
44
-
45
-
46
-
47
-
48
-
49
-
50
-
51
-
52
-
53
-
54
-
55
-
56
-
57
-
58
-
59
-
60
-
61
-
62
-
63
-
64
-
65
-
66
-
67
-
68
-
69
-
70
-
71
-
72
-
73
-
74
-
75
-
76
-
77
-
78
-
79
-
80
-
81
-
82
-
83
-
84
-
85
-
86
-
87
-
88
-
89
-
90
-
91
-
92
-
93
-
94
-
95
-
96
-
97
-
98
-
99
-
100
-
101
-
102
-
103
-
104
-
105
-
106
-
107
-
108
-
109
-
110
-
111
-
112
-
113
-
114
-
115
-
116
-
117
-
118
-
119
-
120
-
121
-
122
-
123
-
124
-
125
-
126
-
127
-
128
-
129
-
130
-
131
-
132
-
133
-
134
-
135
-
136
-
137
-
138
-
139
-
140
-
141
-
142
-
143
-
144
-
145
-
146
-
147
-
148
-
149
-
150
-
151
-
152
-
153
-
154
-
155
-
156
-
157
-
158
-
159
-
160
-
161
-
162
-
163
-
164
-
165
-
166
-
167
-
168
-
169
-
170
-
171
-
172
-
173
-
174
 |
 |

Industrial Activities and Financial Services
Activities: Performance in 2006
The following analyses of the consolidated income statement,
balance sheet and statement of cash flows present separately
the consolidated data of the Group’s Industrial Activities and
Financial Services activities. The latter include the retail
financing, leasing, and rental companies of Fiat Auto, CNH and
Iveco and the banking activities performed by B.U.C. – Banca
Unione di Credito until August 2006 when it was sold. Starting
from the end of 2006 financial services activities are performed
by Ferrari as well.
Principles of analysis
The separation between Industrial Activities and Financial
Services activities is made by preparing specific
sub-consolidated financial statements on the basis of
the normal business performed by each Group company.
Report on Operations Financial Review of the Group 41Report on Operations Financial Review of the Group40
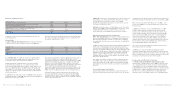
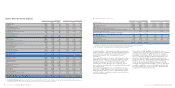
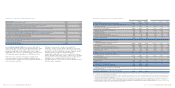
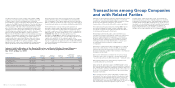
Operating Performance by Activity Segment
2006 2005
Industrial Financial Industrial Financial
(in milioni di euro) Consolidated Activities Services Consolidated Activities Services
Net revenues 51,832 50,297 2,607 46,544 45,350 2,023
Cost of sales 43,888 42,934 2,026 39,624 39,006 1,447
Selling, general and administrative costs 4,697 4,416 281 4,513 4,261 252
Research and developments costs 1,401 1,401 – 1,364 1,364 –
Other income (expenses) 105 109 (4) (43) (37) (6)
Trading Profit 1,951 1,655 296 1,000 682 318
Gains (losses) on the disposal of investments 607 575 32 905 906 (1)
Restructuring costs 450 448 2 502 501 1
Other unusual income (expenses) (47) (45) (2) 812 812 –
Operating result 2,061 1,737 324 2,215 1,899 316
Financial income (expenses) (576) (576) – (843) (843) –
Unusual financial income – – – 858 858 –
Result from investments: (*) 156 95 61 34 133
-Net result of investees accounted for using the equity method 125 64 61 115 82 33
-Other income (expenses) from investments 31 31 – (81) (81) –
Result before taxes 1,641 1,256 385 2,264 1,915 349
Income taxes 490 392 98 844 744 100
Net result 1,151 864 287 1,420 1,171 249
Result from intersegment investments –287 ––248 –
Net result for the year 1,151 1,151 287 1,420 1,419 249
(*) This item includes investment income as well as writedowns and upward adjustments in non-intersegment investments accounted for by using the equity method.
The investments held by companies belonging to one activity
segment in companies included in another segment
are accounted for using the equity method.
To avoid a misleading presentation of net income, the effect
of this accounting is classified in the income statement item
“Result from intersegment investments.”
The Holding companies (Fiat S.p.A., IHF-Internazionale Holding
Fiat S.A., Fiat Partecipazioni S.p.A. and Fiat Netherlands
Holding N.V.) are classified under Industrial Activities.
The sub-consolidated financial statements of Industrial
Activities also include companies that operate centralised
cash management activities, i.e. those which raise financial
resources on the market and finance Group companies without
providing financial services support to third parties.
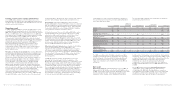
Industrial Activities
In 2006, net revenues for Industrial Activities totalled 50,297
million euros, up 10.9% from the previous year, as a result
of the growth posted by Fiat Auto and Iveco, as well as by the
Components and Production Systems Business Area and CNH.
Industrial Activities reported a trading profit of 1,655 million
euros in 2006, against a trading profit of 682 million euros in
2005. The improvement is mainly attributable to Fiat Auto,
and the growth posted by Iveco and CNH.
The operating result of Industrial Activities was 1,737 million
euros compared to operating income of 1,899 million euros in
2005. The 162-million-euro decrease reflects lower net unusual
income of 1,135 million euros against the improvement in
trading profit (+973 million euros). Unusual income for 2006
totalled 82 million euros and included, among other things, the
gain of 429 million euros arising from the sale of 50% of FAFS
(the residual 34 million euros were recorded within the
perimeter of Financial Services activities), net of restructuring
costs of 448 million euros and other unusual charges of 45
million euros. In 2005, net unusual income totalled 1,217
million euros and included in particular the unusual income
of 1,134 million euros from the General Motors settlement,
and the gain of 878 million euros on the sale of the investment
in Italenergia Bis.