Chrysler 2006 Annual Report Download - page 24
Download and view the complete annual report
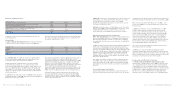
Please find page 24 of the 2006 Chrysler annual report below. You can navigate through the pages in the report by either clicking on the pages listed below, or by using the keyword search tool below to find specific information within the annual report.-
 1
1 -
2
-
3
-
4
-
5
-
6
-
7
-
8
-
9
-
10
-
11
-
12
-
13
-
 14
14 -
 15
15 -
 16
16 -
 17
17 -
 18
18 -
 19
19 -
 20
20 -
 21
21 -
 22
22 -
 23
23 -
 24
24 -
 25
25 -
 26
26 -
 27
27 -
 28
28 -
 29
29 -
 30
30 -
 31
31 -
 32
32 -
 33
33 -
 34
34 -
35
-
36
-
37
-
38
-
39
-
40
-
41
-
42
-
43
-
44
-
45
-
46
-
47
-
48
-
49
-
50
-
51
-
52
-
53
-
54
-
55
-
56
-
57
-
58
-
59
-
60
-
61
-
62
-
63
-
64
-
65
-
66
-
67
-
68
-
69
-
70
-
71
-
72
-
73
-
74
-
75
-
76
-
77
-
78
-
79
-
80
-
81
-
82
-
83
-
84
-
85
-
86
-
87
-
88
-
89
-
90
-
91
-
92
-
93
-
94
-
95
-
96
-
97
-
98
-
99
-
100
-
101
-
102
-
103
-
104
-
105
-
106
-
107
-
108
-
109
-
110
-
111
-
112
-
113
-
114
-
115
-
116
-
117
-
118
-
119
-
120
-
121
-
122
-
123
-
124
-
125
-
126
-
127
-
128
-
129
-
130
-
131
-
132
-
133
-
134
-
135
-
136
-
137
-
138
-
139
-
140
-
141
-
142
-
143
-
144
-
145
-
146
-
147
-
148
-
149
-
150
-
151
-
152
-
153
-
154
-
155
-
156
-
157
-
158
-
159
-
160
-
161
-
162
-
163
-
164
-
165
-
166
-
167
-
168
-
169
-
170
-
171
-
172
-
173
-
174
 |
 |

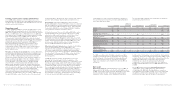
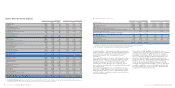
Balance Sheet by Activity Segment
At 12.31.2006 At 12.31.2005
Industrial Financial Industrial Financial
(in millions of euros) Consolidated Activities Services Consolidated Activities Services
Intangible assets 6,421 6,325 96 5,943 5,762 181
-Goodwill 2,850 2,756 94 2,418 2,259 159
-Other intangible assets 3,571 3,569 2 3,525 3,503 22
Property,plant and equipment 10,540 10,528 12 11,006 10,961 45
Investment property 19 19 – 26 26 –
Investments and other financial assets 2,280 3,886 867 2,333 4,184 796
Leased assets 247 7 240 1,254 4 1,250
Defined benefit plan assets 11 11 – –––
Deferred tax assets 1,860 1,710 150 2,104 1,930 174
Total Non-current Assets 21,378 22,486 1,365 22,666 22,867 2,446
Inventories 8,447 8,390 57 7,881 7,809 76
Trade receivables 4,944 5,068 178 4,969 4,856 341
Receivables from financing activities 11,743 2,891 11,977 15,973 4,881 15,856
Other receivables 2,839 2,806 58 3,084 2,922 243
Accrued income and prepaid expenses 247 226 21 272 253 21
Current financial assets 637 531 106 1,041 663 378
-Current investments 31 31 –31 31 –
-Current securities 224 134 90 556 204 352
-Other financial assets 382 366 16 454 428 26
Cash and cash equivalents 7,736 6,706 1,030 6,417 5,517 900
Total Current Assets 36,593 26,618 13,427 39,637 26,901 17,815
Assets held for sale 332 332 – 151 151 –
TOTAL ASSETS 58,303 49,436 14,792 62,454 49,919 20,261
Total assets adjusted for asset-backed financing transactions 49,959 48,504 7,313 51,725 48,388 10,797
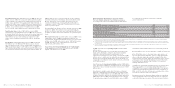
Stockholders’ equity 10,036 10,036 2,395 9,413 9,409 2,479
Provisions 8,611 8,471 140 8,698 8,499 199
-Employee benefits (a) 3,761 3,750 11 3,950 3,925 25
-Other provisions (a) 4,850 4,721 129 4,748 4,574 174
Debt 20,188 11,555 11,836 25,761 13,782 16,915
-Asset-backed financing (b) 8,344 932 7,479 10,729 1,531 9,464
-Other debt (b) 11,844 10,623 4,357 15,032 12,251 7,451
Other financial liabilities 105 98 7189 180 9
Trade payables 12,603 12,637 260 11,777 11,700 297
Other payables 5,019 4,963 89 4,821 4,698 205
Deferred tax liabilities 263 262 1 405 375 29
Accrued expenses and deferred income 1,169 1,105 64 1,280 1,166 128
Liabilities held for sale 309 309 – 110 110 –
TOTAL STOCKHOLDERS’ EQUITY AND LIABILITIES 58,303 49,436 14,792 62,454 49,919 20,261
Total liabilities adjusted for asset-backed financing transactions 49,959 48,504 7,313 51,725 48,388 10,797
(a) The amounts at December 31, 2005 differ from those published in the Consolidated Financial Statements at December 31, 2005 due to the reclassification described in the Notes to the
Consolidated Financial Statements.
(b) The amounts of “Other debt” and “Asset-backed financing” of the Group and the Financial Services Companies at December 31, 2005 differ from those published in the Consolidated Financial
Statements at December 31, 2005 due to the reclassification described in the Notes to the Consolidated Financial Statements.
Report on Operations Financial Review of the Group 45Report on Operations Financial Review of the Group44
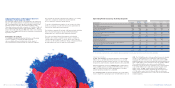
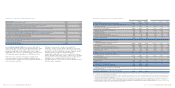
Net Debt by Activity Segment
At 12.31.2006 At 12.31.2005
Industrial Financial Industrial Financial
(in millions of euros) Consolidated Activities Services Consolidated Activities Services
Debt (20,188) (11,555) (11,836) (25,761) (13,782) (16,915)
-Asset-backed financing (a) (8,344) (932) (7,479) (10,729) (1,531) (9,464)
-Other debt (a) (11,844) (10,623) (4,357) (15,032) (12,251) (7,451)
Debt included among liabilities held for sale (33) (33) – –––
Current financial receivables from jointly controlled financial entities (b) 143 143 – –––
Intersegment financial receivables – 2,559 644 – 4,594 342
Financial payables net of intersegment balances and current
financial receivables from jointly controlled financial entities (20,078) (8,886) (11,192) (25,761) (9,188) (16,573)
Other financial assets (c) 382 366 16 454 428 26
Other financial liabilities (c) (105) (98) (7) (189) (180) (9)
Current securities 224 134 90 556 204 352
Cash and cash equivalents 7,736 6,706 1,030 6,417 5,517 900
Cash and cash equivalents included among assets held for sale 55– –––
Net debt (11,836) (1,773) (10,063) (18,523) (3,219) (15,304)
(a) The amounts of “Other debt” and “Asset-backed financing” of the Group and the financial services companies at December 31, 2005 differ from those published in the Consolidated Financial
Statements at December 31, 2005 due to the reclassification described in the Notes to the Consolidated Financial Statements.
(b) This item includes current financial receivables due to Fiat Group companies by the FAFS Group.
(c) This item includes the asset and liability fair values of derivative financial instruments.
“Financial payables” under Industrial Activities partly include
funds raised by the central cash management and transferred
to financial services companies in support of their activity
(represented under the item “Intersegment financial
receivables”).
“Intersegment financial receivables” under Financial Services
represent loans or advances to industrial companies, mainly
relating to the sale of receivables by industrial to financial
companies in transactions that do not comply with the
requirements set out in IAS 39 for the recognition of those
sales, as well as any temporary cash deposited with the central
cash management.
“Cash and cash equivalents” include 627 million euros at
December 31, 2006 (706 million euros at December 31, 2005),
mainly relating to financial services companies, allocated to
service the debt for securitisation structures and classified as
“Asset-backed financing”.
At December 31, 2006, net debt of the financial services
companies showed a decrease of 5,241 million euros compared
to net debt at December 31, 2005. The decrease is mainly
attributable to the positive effects of the sale of the financial
services companies of Fiat Auto within the framework of the
transaction with Crédit Agricole (approximately 4.8 billion
euros) and of B.U.C. – Banca Unione di Credito (approximately
0.8 billion euros), the operating performance (734 million
euros), and to the translation effects of changes in foreign
exchange rates (approximately 0.8 billion euros), in part offset
by capital expenditures carried out during the period (mainly
for vehicles that had been leased out under operating leases),
and growth in the investment portfolio.