Chrysler 2006 Annual Report Download - page 45
Download and view the complete annual report
Please find page 45 of the 2006 Chrysler annual report below. You can navigate through the pages in the report by either clicking on the pages listed below, or by using the keyword search tool below to find specific information within the annual report.-
 1
1 -
2
-
3
-
4
-
5
-
6
-
7
-
8
-
9
-
10
-
11
-
12
-
13
-
14
-
15
-
16
-
17
-
18
-
19
-
20
-
21
-
22
-
23
-
24
-
25
-
26
-
27
-
28
-
29
-
30
-
31
-
32
-
33
-
34
-
 35
35 -
 36
36 -
 37
37 -
 38
38 -
 39
39 -
 40
40 -
 41
41 -
 42
42 -
 43
43 -
 44
44 -
 45
45 -
 46
46 -
 47
47 -
 48
48 -
 49
49 -
 50
50 -
 51
51 -
 52
52 -
 53
53 -
 54
54 -
 55
55 -
56
-
57
-
58
-
59
-
60
-
61
-
62
-
63
-
64
-
65
-
66
-
67
-
68
-
69
-
70
-
71
-
72
-
73
-
74
-
75
-
76
-
77
-
78
-
79
-
80
-
81
-
82
-
83
-
84
-
85
-
86
-
87
-
88
-
89
-
90
-
91
-
92
-
93
-
94
-
95
-
96
-
97
-
98
-
99
-
100
-
101
-
102
-
103
-
104
-
105
-
106
-
107
-
108
-
109
-
110
-
111
-
112
-
113
-
114
-
115
-
116
-
117
-
118
-
119
-
120
-
121
-
122
-
123
-
124
-
125
-
126
-
127
-
128
-
129
-
130
-
131
-
132
-
133
-
134
-
135
-
136
-
137
-
138
-
139
-
140
-
141
-
142
-
143
-
144
-
145
-
146
-
147
-
148
-
149
-
150
-
151
-
152
-
153
-
154
-
155
-
156
-
157
-
158
-
159
-
160
-
161
-
162
-
163
-
164
-
165
-
166
-
167
-
168
-
169
-
170
-
171
-
172
-
173
-
174
 |
 |

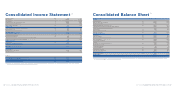
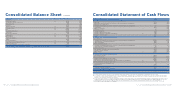
(in millions of euros) Note At December 31, 2006 At December 31, 2005
ASSETS
Intangible assets (13) 6,421 5,943
Property, plant and equipment (14) 10,540 11,006
Investment property (15) 19 26
Investments and other financial assets: (16) 2,280 2,333
-Investments accounted for using the equity method 1,719 1,762
-Other investments and financial assets 561 571
Leased assets (17) 247 1,254
Defined benefit plan assets (26) 11 –
Deferred tax assets (11) 1,860 2,104
Total Non-current assets 21,378 22,666
Inventories (18) 8,447 7,881
Trade receivables (19) 4,944 4,969
Receivables from financing activities (19) 11,743 15,973
Other receivables: (19) 2,839 3,084
-Current tax receivables 808 778
-Others 2,031 2,306
Accrued income and prepaid expenses (20) 247 272
Current financial assets: 637 1,041
-Current investments 31 31
-Current securities (21) 224 556
-Other financial assets (22) 382 454
Cash and cash equivalents (23) 7,736 6,417
Total Current assets 36,593 39,637
Assets held for sale (24) 332 151
TOTAL ASSETS 58,303 62,454
- Total assets adjusted for asset-backed financing transactions 49,959 51,725
(*) Pursuant to Consob Resolution No. 15519 of July 27, 2006, the effects of related party transactions on the Consolidated Balance Sheet are presented in the specific Balance Sheet schedule
provided in the following pages and are further described in Note 35.
Fiat Group Consolidated Financial Statements at December 31, 2006 87
Consolidated Balance Sheet
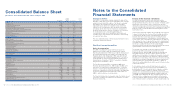
(in millions of euros) Note 2006 2005
Net revenues (1) 51,832 46,544
Cost of sales (2) 43,888 39,624
Selling, general and administrative costs (3) 4,697 4,513
Research and development costs (4) 1,401 1,364
Other income (expenses) (5) 105 (43)
Trading profit 1,951 1,000
Gains (losses) on the disposal of investments (6) 607 905
Restructuring costs (7) 450 502
Other unusual income (expenses) (8) (47) 812
Operating result 2,061 2,215
Financial income (expenses) (9) (576) (843)
Unusual financial income (9) –858
Result from investments: (10) 156 34
-Net result of investees accounted for using the equity method 125 115
-Other income (expenses) from investments 31 (81)
Result before taxes 1,641 2,264
Income taxes (11) 490 844
Result from continuing operations 1,151 1,420
Result from discontinued operations ––
Net result 1,151 1,420
Attributable to:
Equity holders of the parent 1,065 1,331
Minority interests 86 89
(in euros)
Basic earnings per ordinary and preference share (12) 0.789 1.250
Basic earnings per savings share (12) 1.564 1.250
Diluted earnings per ordinary and preference share (12) 0.788 1.250
Diluted earnings per savings share (12) 1.563 1.250
(*) Pursuant to Consob Resolution No. 15519 of July 27, 2006, the effects of related party transactions on the Consolidated Income Statement are presented in the specific Income Statement
schedule provided in the following pages and are further described in Note 35.
Fiat Group Consolidated Financial Statements at December 31, 200686
Consolidated Income Statement (*) (*)