Chrysler 2006 Annual Report Download - page 62
Download and view the complete annual report
Please find page 62 of the 2006 Chrysler annual report below. You can navigate through the pages in the report by either clicking on the pages listed below, or by using the keyword search tool below to find specific information within the annual report.-
 1
1 -
2
-
3
-
4
-
5
-
6
-
7
-
8
-
9
-
10
-
11
-
12
-
13
-
14
-
15
-
16
-
17
-
18
-
19
-
20
-
21
-
22
-
23
-
24
-
25
-
26
-
27
-
28
-
29
-
30
-
31
-
32
-
33
-
34
-
35
-
36
-
37
-
38
-
39
-
40
-
41
-
42
-
43
-
44
-
45
-
46
-
47
-
48
-
49
-
50
-
51
-
 52
52 -
 53
53 -
 54
54 -
 55
55 -
 56
56 -
 57
57 -
 58
58 -
 59
59 -
 60
60 -
 61
61 -
 62
62 -
 63
63 -
 64
64 -
 65
65 -
 66
66 -
 67
67 -
 68
68 -
 69
69 -
 70
70 -
 71
71 -
 72
72 -
73
-
74
-
75
-
76
-
77
-
78
-
79
-
80
-
81
-
82
-
83
-
84
-
85
-
86
-
87
-
88
-
89
-
90
-
91
-
92
-
93
-
94
-
95
-
96
-
97
-
98
-
99
-
100
-
101
-
102
-
103
-
104
-
105
-
106
-
107
-
108
-
109
-
110
-
111
-
112
-
113
-
114
-
115
-
116
-
117
-
118
-
119
-
120
-
121
-
122
-
123
-
124
-
125
-
126
-
127
-
128
-
129
-
130
-
131
-
132
-
133
-
134
-
135
-
136
-
137
-
138
-
139
-
140
-
141
-
142
-
143
-
144
-
145
-
146
-
147
-
148
-
149
-
150
-
151
-
152
-
153
-
154
-
155
-
156
-
157
-
158
-
159
-
160
-
161
-
162
-
163
-
164
-
165
-
166
-
167
-
168
-
169
-
170
-
171
-
172
-
173
-
174
 |
 |
Fiat Group Consolidated Financial Statements at December 31, 2006 -Notes 121
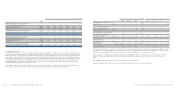
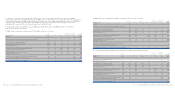
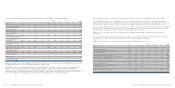
In 2006 Changes in accumulated amortisation and impairment losses were as follows:
Translation
At Changes in Reclassified differences At
December Impairment the scope of to Assets and other December
(in millions of euros) 31, 2005 Amortisation losses Divestitures consolidation held for sale changes 31, 2006
Goodwill 741 – 48 – – (38) (67) 684
Trademarks and other intangible assets
with indefinite useful lives 61 – – – – – (11) 50
-Development costs externally acquired 667 287 2 (1) – – 46 1,001
-Development costs internally generated 784 329 5(5) – – (62) 1,051
Total Development costs 1,451 616 7 (6) – – (16) 2,052
-Patents, concessions and licenses externally acquired 530 148 – (105) (10) – (9) 554
Total Patents, concessions and licenses 530 148 – (105) (10) – (9) 554
-Other intangible assets externally acquired 459 58 – (33) (52) (6) (2) 424
Total Other intangible assets 459 58 – (33) (52) (6) (7) 424
-Advances and intangible assets
in progress externally acquired 6 – – – – – (6) –
Total Advances and intangible assets in progress 6 – – – – – (6) –
Total accumulated amortisation
and impairment of Intangible assets 3,248 822 55 (144) (62) (44) (111) 3,764
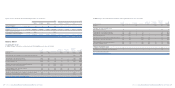
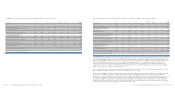
Figures used to determine diluted earning per shares are as follows:
2006 2005
Ordinary Preference Saving Ordinary Preference Saving
shares shares shares Total shares shares shares Total
Profit attributable to
each class of shares million of euros 859 81 125 1,065 1,102 129 100 1,331
Weighted average number
of shares thousand 1,088,027 103,292 79,913 1,271,232 881,177 103,292 79,913 1,064,382
Number of shares that would
be issued from stock option plans thousand 1,580 –– 1,580 – – ––
Total number of shares considered
in the diluted earning per share thousand 1,089,607 103,292 79,913 1,272,812 881,177 103,292 79,913 1,064,382
Diluted earning per share euros 0.788 0.788 1.563 1.250 1.250 1.250
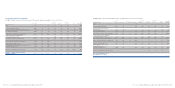
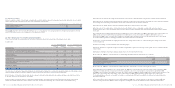
Balance Sheet
13. Intangible assets
In 2006, changes in the gross carrying amount of Intangible assets were as follows:
Translation
At Changes in Reclassified differences At
December the scope of to Assets and other December
(in millions of euros) 31, 2005 Additions Divestitures consolidation held for sale changes 31, 2006
Goodwill 3,159 781 –(57) (44) (305) 3,534
Trademarks and other intangible assets with indefinite useful lives 283 1 – – – (55) 229
-Development costs externally acquired 1,822 414 (7) (1) – 148 2,376
-Development costs internally generated 2,232 399 (5) –(1) (173) 2,452
Total Development costs 4,054 813 (12) (1) (1) (25) 4,828
-Patents, concessions and licenses externally acquired 999 81 (106) (13) – 29 990
Total Patents, concessions and licenses 999 81 (106) (13) – 29 990
-Other intangible assets externally acquired 596 38 (35) (64) (7) 24 552
Total Other intangible assets 596 38 (35) (64) (7) 24 552
-Advances and intangible assets in progress externally acquired 100 19 – – – (67) 52
Total Advances and intangible assets in progress 100 19 – – – (67) 52
Total gross carrying amount of Intangible assets 9,191 1,733 (153) (135) (52) (399) 10,185
Fiat Group Consolidated Financial Statements at December 31, 2006 -Notes 120