Chrysler 2006 Annual Report Download - page 91
Download and view the complete annual report
Please find page 91 of the 2006 Chrysler annual report below. You can navigate through the pages in the report by either clicking on the pages listed below, or by using the keyword search tool below to find specific information within the annual report.-
 1
1 -
2
-
3
-
4
-
5
-
6
-
7
-
8
-
9
-
10
-
11
-
12
-
13
-
14
-
15
-
16
-
17
-
18
-
19
-
20
-
21
-
22
-
23
-
24
-
25
-
26
-
27
-
28
-
29
-
30
-
31
-
32
-
33
-
34
-
35
-
36
-
37
-
38
-
39
-
40
-
41
-
42
-
43
-
44
-
45
-
46
-
47
-
48
-
49
-
50
-
51
-
52
-
53
-
54
-
55
-
56
-
57
-
58
-
59
-
60
-
61
-
62
-
63
-
64
-
65
-
66
-
67
-
68
-
69
-
70
-
71
-
72
-
73
-
74
-
75
-
76
-
77
-
78
-
79
-
80
-
 81
81 -
 82
82 -
 83
83 -
 84
84 -
 85
85 -
 86
86 -
 87
87 -
 88
88 -
 89
89 -
 90
90 -
 91
91 -
 92
92 -
 93
93 -
 94
94 -
 95
95 -
 96
96 -
 97
97 -
 98
98 -
 99
99 -
 100
100 -
 101
101 -
102
-
103
-
104
-
105
-
106
-
107
-
108
-
109
-
110
-
111
-
112
-
113
-
114
-
115
-
116
-
117
-
118
-
119
-
120
-
121
-
122
-
123
-
124
-
125
-
126
-
127
-
128
-
129
-
130
-
131
-
132
-
133
-
134
-
135
-
136
-
137
-
138
-
139
-
140
-
141
-
142
-
143
-
144
-
145
-
146
-
147
-
148
-
149
-
150
-
151
-
152
-
153
-
154
-
155
-
156
-
157
-
158
-
159
-
160
-
161
-
162
-
163
-
164
-
165
-
166
-
167
-
168
-
169
-
170
-
171
-
172
-
173
-
174
 |
 |

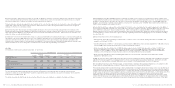
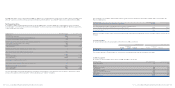
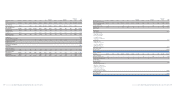
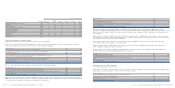
Fiat Group Consolidated Financial Statements at December 31, 2006 -Notes 179
Other and
Magneti Business elimina- FIAT
(in millions of euros) Fiat Auto Maserati Ferrari CNH Iveco FPT Marelli Teksid Comau Solutions Itedi tions Group
At December 31, 2006
Sector operating assets 12,920 300 918 17,727 6,125 4,103 2,294 424 933 103 243 (514) 45,576
Sector operating
assets held-for-sale 28 – – 29 6 – – 192 – 125 – (68) 312
Investments 1,131 – 3 347 426 18 16 17 3 1 11 105 2,078
Unallocated
Group assets:
- Tax assets 2,675
-Receivables from
financing activities,
Non-current Other
receivables and
Securities of industrial
companies 450
-Cash and cash
equivalents, Current
securities and Other
financial assets of
industrial companies 7,212
Total unallocated
Group assets 10,337
Total assets 58,303
Sector operating
liabilities 12,396 367 634 14,653 5,784 2,444 1,625 292 712 213 188 (1,226) 38,082
Sector operating
liabilities held-for-sale 50 – – – – – – 73 – 147 – (1) 269
Provision for investments 19 – – – 39 3 4 – 2 – – – 67
Unallocated
Group liabilities:
- Tax liabilities 864
- Debt and Other financial
liabilities of industrial
companies net of Current
financial receivables
from jointly controlled
financial services entities 8,985
Total unallocated
Group liabilities 9,849
Total liabilities 48,267
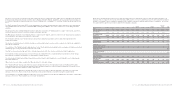
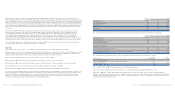
Other and
Magneti Business elimina- FIAT
(in millions of euros) Fiat Auto Maserati Ferrari CNH Iveco FPT Marelli Teksid Comau Solutions Itedi tions Group
2005
Total net revenues 19,533 533 1,289 10,212 8,483 4,520 4,033 1,036 1,573 752 397 (5,817) 46,544
Net revenues
intersegment (194) – (83) (3) (386) (3,030) (1,473) (206) (245) (422) (10) 6,052 –
Net revenues from
third parties 19,339 533 1,206 10,209 8,097 1,490 2,560 830 1,328 330 387 235 46,544
Trading profit (281) (85) 157 698 332 109 162 45 42 35 16 (230) 1,000
Unusual income
(expenses) (537) –– (87) (120) (28) (35) (18) (50) (28) (3) 2,121 1,215
Operating result (818) (85) 157 611 212 81 127 27 (8) 7 13 1,891 2,215
Financial income
(expenses) (843)
Unusual financial income 858
Result from investments 68 – – 39 (50) (3) (3) 1 (3) (20) – 5 34
Result before taxes 2,264
Income taxes 844
Result from continuing
operations 1,420
Other information
Capital expenditure 1,582 20 142 255 789 296 313 45 38 19 20 1 3,520
Depreciation and
amortisation (1,264) (37) (128) (296) (396) (310) (181) (45) (27) (28) (7) (21) (2,740)
Impairment (151) – – – (36) (1) (16) – – (3) – (26) (233)
Other non-cash items (1,259) (34) (52) (1,311) (591) (91) (102) (44) (53) (25) (1) (166) (3,729)
Fiat Group Consolidated Financial Statements at December 31, 2006 -Notes 178