Chrysler 2006 Annual Report Download - page 41
Download and view the complete annual report
Please find page 41 of the 2006 Chrysler annual report below. You can navigate through the pages in the report by either clicking on the pages listed below, or by using the keyword search tool below to find specific information within the annual report.-
 1
1 -
2
-
3
-
4
-
5
-
6
-
7
-
8
-
9
-
10
-
11
-
12
-
13
-
14
-
15
-
16
-
17
-
18
-
19
-
20
-
21
-
22
-
23
-
24
-
25
-
26
-
27
-
28
-
29
-
30
-
 31
31 -
 32
32 -
 33
33 -
 34
34 -
 35
35 -
 36
36 -
 37
37 -
 38
38 -
 39
39 -
 40
40 -
 41
41 -
 42
42 -
 43
43 -
 44
44 -
 45
45 -
 46
46 -
 47
47 -
 48
48 -
 49
49 -
 50
50 -
 51
51 -
52
-
53
-
54
-
55
-
56
-
57
-
58
-
59
-
60
-
61
-
62
-
63
-
64
-
65
-
66
-
67
-
68
-
69
-
70
-
71
-
72
-
73
-
74
-
75
-
76
-
77
-
78
-
79
-
80
-
81
-
82
-
83
-
84
-
85
-
86
-
87
-
88
-
89
-
90
-
91
-
92
-
93
-
94
-
95
-
96
-
97
-
98
-
99
-
100
-
101
-
102
-
103
-
104
-
105
-
106
-
107
-
108
-
109
-
110
-
111
-
112
-
113
-
114
-
115
-
116
-
117
-
118
-
119
-
120
-
121
-
122
-
123
-
124
-
125
-
126
-
127
-
128
-
129
-
130
-
131
-
132
-
133
-
134
-
135
-
136
-
137
-
138
-
139
-
140
-
141
-
142
-
143
-
144
-
145
-
146
-
147
-
148
-
149
-
150
-
151
-
152
-
153
-
154
-
155
-
156
-
157
-
158
-
159
-
160
-
161
-
162
-
163
-
164
-
165
-
166
-
167
-
168
-
169
-
170
-
171
-
172
-
173
-
174
 |
 |
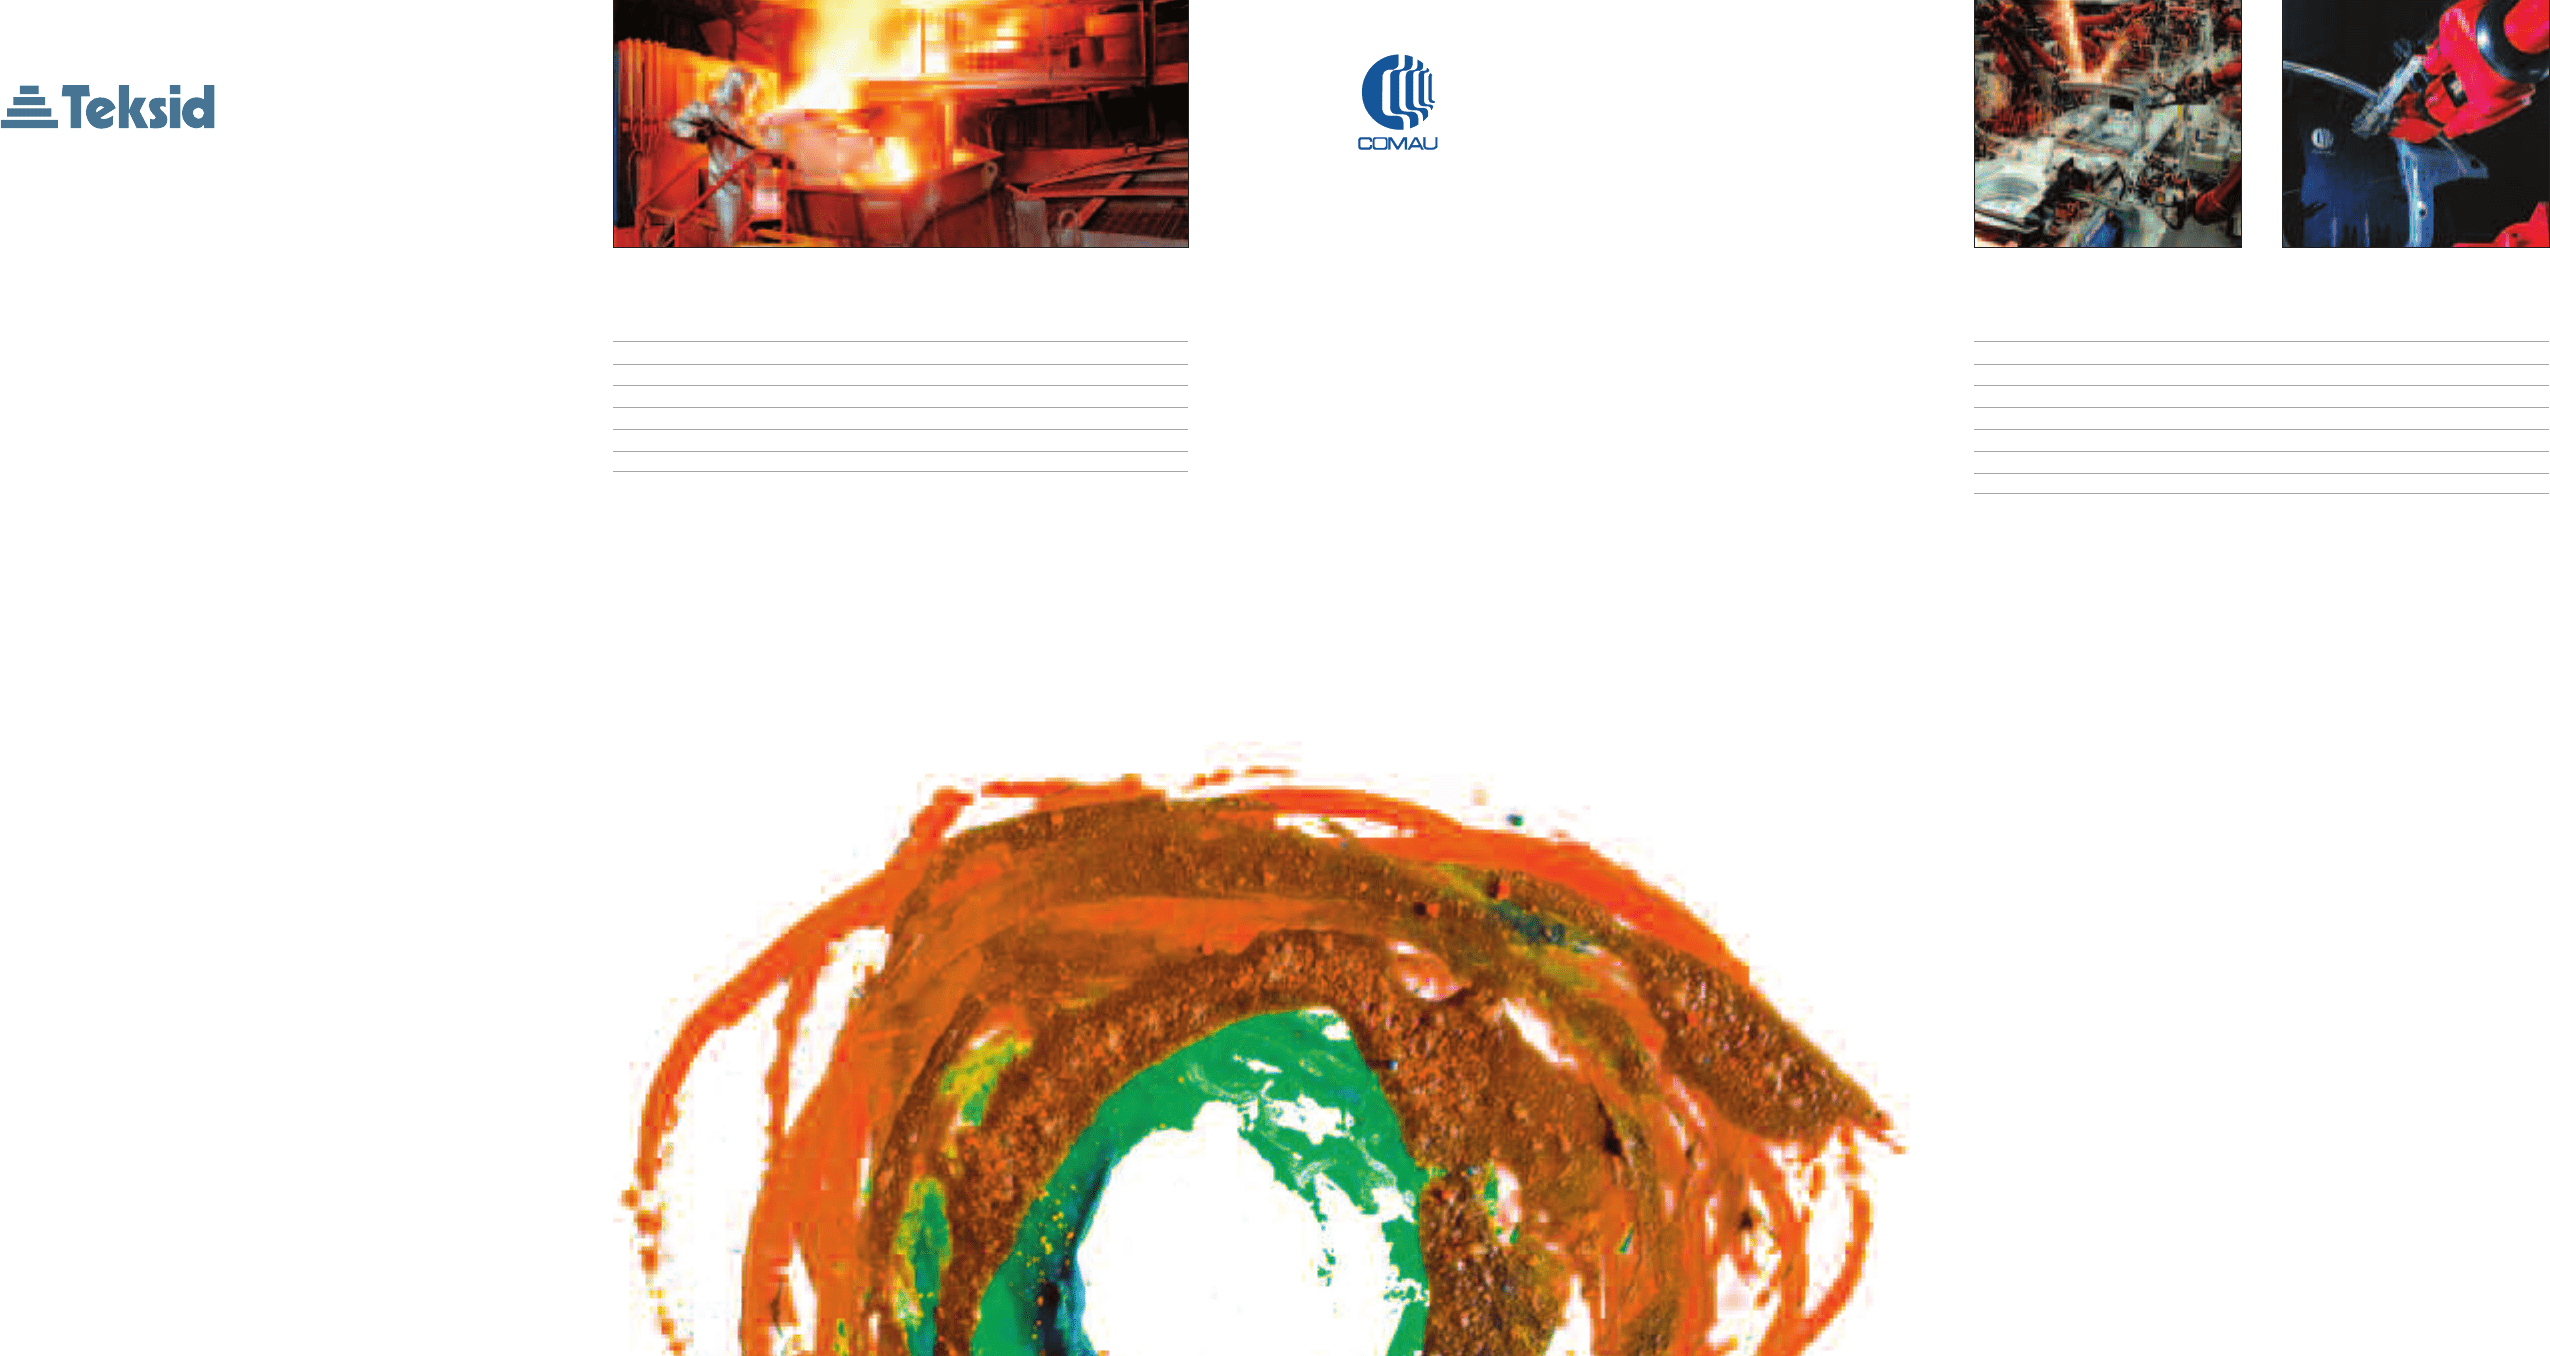
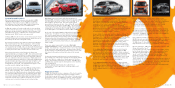
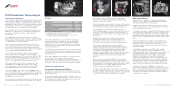
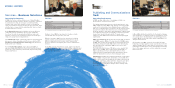
Operating Performance
In 2006, the Sector’s reference market continued to be
impacted by uncertainty, shrinking volumes and intense
pressure on prices.
Car manufacturers in the Western World generally scaled back
their investment programs, but they did not stop introducing
new models on the market. They continued to focus on
converting existing facilities and rationalising production
capacity,while greenfield investments were suspended or
postponed.
By contrast, a number of countries in Asia and Eastern Europe
have shown an increase in investments, often through joint
ventures between Western car manufacturers and local
partners.
The unfavourable market conditions negatively impacted
Comau revenues, which decreased by approximately 18.6%
from 2005 mainly due to a slowdown in activity levels at the
European Body-welding operations.
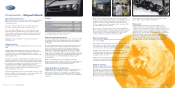
To meet the challenge of slow markets, flagging order intake
and diminishing revenues, Comau embarked on a restructuring
program in the third quarter of 2006, reshaping the scope of
its activities and presence in the countries where it operates.
The programme will start to show benefits in 2007, while its
full effect on profitability will be achieved from 2008 onwards.
With markets shrinking, order intake totalled 1,194 million
euros in 2006, down approximately 16% from 2005.
In 2006, new orders for contract work came to 929 million
euros, down 23% from 2005. Overall, 54% of the orders for
contract work were acquired in Europe, 27% in the Nafta area,
while the remaining 19% came from the Mercosur and new
markets (5% in China). 32% of all orders came from Fiat Group
companies and 68% from other manufacturers. At
December 31, 2006 the order backlog totalled 593 million
euros, down approximately 15% from 2005.
For Service operations, 2006 saw a significant increase
in orders (+11%), reaching a value of 265 million euros
(25% of which coming from Fiat Group companies).
Report on Operations Comau 79Report on Operations Teksid78
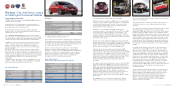
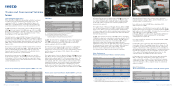
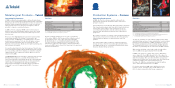
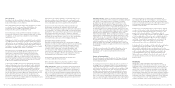
Operating Performance
In 2006, an unsettled energy market continued to put strong
pressure on the metallurgical industry. Against this challenging
background, the Sector’s diversification in terms of customers,
products and geographical destination, as well as ongoing
improvements in process efficiency and logistics, made it
possible to improve overall performance.
In 2006, a French company (SBFM) active in the Cast Iron
business was sold. Excluding the impact of this sale, Teksid
revenues would have increased (+3.5%) with respect to the
previous year.
Revenues of the Cast Iron Business Unit decreased by 5.6%
and volumes by 6.5%. The change is connected to the
mentioned sale of SBFM. On a comparable basis, revenues
would have increased by 7.2% due to both higher volumes
(+1.5%) and the favourable effect of exchange rates, the
Brazilian real in particular.Brazil was the highest growing area
also in terms of revenues.
It is worth noting that in the Cast Iron business, Teksid is also
active in China through Hua Dong Teksid Automotive Foundry
Co. Ltd, a jointly controlled company accounted for using the
equity method. This company recorded a 20.2% increase in
volumes from 2005.
The Magnesium Business Unit (where Teksid operates through
Meridian Technologies Inc., in which Teksid holds a 51%
interest and Norway’s Norsk Hydro group the remaining 49%)
recorded a reduction in both revenues (-5.2%) and volumes
(-6.2%) due to a slowdown in the reference market, in
particular the North American market, which nevertheless
continued to account for approximately 80% of revenues
in 2006.
As part of Teksid’s strategy to focus on its core business,
in December 2006 the Fiat Group and Norsk Hydro reached
an agreement for the sale of their interests in Meridian
Technologies Inc. to a consortium of investors headed by
the Swiss holding company Estatia AG. Completion of the
transaction is subject to approval by competent authorities
(received in 2007) and closing of the financing to the purchaser
by financial institutions.
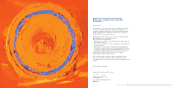
Metallurgical Products – Teksid Production Systems – Comau
Highlights
(in millions of euros) 2006 2005
Net revenues 979 1,036
Trading profit 56 45
Operating result (*) 26 27
Investments in tangible and intangible assets 32 45
Total R&D expenses (**) 55
Employees at year-end (number) 8,342 8,952
(*) Including restructuring costs and unusual income (expenses).
(**) Including R&D capitalised and charged to operations.
Highlights
(in millions of euros) 2006 2005
Net revenues 1,280 1,573
Trading profit (66) 42
Operating result (*) (272) (8)
Investments in tangible and intangible assets (**) 56 38
-of which capitalised R&D costs 79
Total R&D expenses (***) 20 20
Employees at year-end (number) 12,293 12,725
(*) Including restructuring costs and unusual income (expenses).
(**) The 2006 figure includes 34 million euros for investments by Comau North America
related to sales/leaseback transactions carried out in previous years.
(***) Including R&D capitalised and charged to operations.