Travelers 2003 Annual Report Download - page 89
Download and view the complete annual report
Please find page 89 of the 2003 Travelers annual report below. You can navigate through the pages in the report by either clicking on the pages listed below, or by using the keyword search tool below to find specific information within the annual report.-
 1
1 -
2
-
3
-
4
-
5
-
6
-
7
-
8
-
9
-
10
-
11
-
12
-
13
-
14
-
15
-
16
-
17
-
18
-
19
-
20
-
21
-
22
-
23
-
24
-
25
-
26
-
27
-
28
-
29
-
30
-
31
-
32
-
33
-
34
-
35
-
36
-
37
-
38
-
39
-
40
-
41
-
42
-
43
-
44
-
45
-
46
-
47
-
48
-
49
-
50
-
51
-
52
-
53
-
54
-
55
-
56
-
57
-
58
-
59
-
60
-
61
-
62
-
63
-
64
-
65
-
66
-
67
-
68
-
69
-
70
-
71
-
72
-
73
-
74
-
75
-
76
-
77
-
78
-
 79
79 -
 80
80 -
 81
81 -
 82
82 -
 83
83 -
 84
84 -
 85
85 -
 86
86 -
 87
87 -
 88
88 -
 89
89 -
 90
90 -
 91
91 -
 92
92 -
 93
93 -
 94
94 -
 95
95 -
 96
96 -
 97
97 -
 98
98 -
 99
99 -
100
-
101
-
102
-
103
-
104
-
105
-
106
-
107
-
108
-
109
-
110
-
111
-
112
-
113
-
114
-
115
-
116
-
117
-
118
-
119
-
120
-
121
-
122
-
123
-
124
-
125
-
126
-
127
-
128
-
129
-
130
-
131
-
132
-
133
-
134
-
135
-
136
-
137
-
138
-
139
-
140
-
141
-
142
-
143
-
144
-
145
-
146
-
147
-
148
-
149
-
150
-
151
-
152
-
153
-
154
-
155
-
156
 |
 |

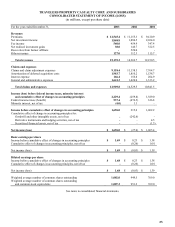
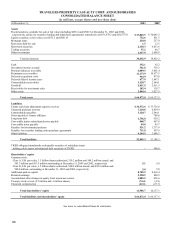
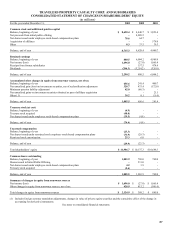
87
TRAVELERS PROPERTY CASUALTY CORP. AND SUBSIDIARIES
CONSOLIDATED STATEMENT OF CHANGES IN SHAREHOLDERS’ EQUITY
(in millions)
For the year ended December 31, 2003 2002 2001
Common stock and additional paid-in capital
Balance, beginning of year $ 8,628.4 $ 4,440.7 $ 3,823.4
Net proceeds from initial public offering - 4,089.5 -
Net shares issued under employee stock-based compensation plans 78.6 64.7 -
Acquisition of affiliates - - 578.0
Other 8.3 33.5 39.3
Balance, end of year 8,715.3 8,628.4 4,440.7
Retained earnings
Balance, beginning of year 880.5 6,004.2 4,989.9
Net income (loss) 1,696.0 (27.0) 1,065.4
Receipts from former subsidiaries - 157.5 474.9
Dividends (286.3) (5,254.2) (526.0)
Balance, end of year 2,290.2 880.5 6,004.2
Accumulated other changes in equity from nonowner sources, net of tax
Balance, beginning of year 656.6 241.4 400.7
Net unrealized gain (loss) on investment securities, net of reclassification adjustment 328.7 475.4 (172.0)
Minimum pension liability adjustment 62.0 (68.3) -
Net unrealized gains on investment securities obtained as part of affiliate acquisition - - 21.1
Other (1) 38.2 8.1 (8.4)
Balance, end of year 1,085.5 656.6 241.4
Treasury stock (at cost)
Balance, beginning of year (4.9) - -
Treasury stock acquired (40.0) - -
Net shares issued under employee stock-based compensation plans (29.5) (4.9) -
Balance, end of year (74.4) (4.9) -
Unearned compensation
Balance, beginning of year (23.3) - -
Net shares issued under restricted stock employee stock-based compensation plans (31.9) (29.3) -
Restricted stock amortization 25.3 6.0 -
Balance, end of year (29.9) (23.3) -
Total shareholders’ equity $ 11,986.7 $ 10,137.3 $ 10,686.3
Common shares outstanding
Balance, beginning of year 1,003.9 769.0 769.0
Shares issued in Initial Public Offering - 231.0 -
Net shares issued under employee stock-based compensation plans 4.2 3.9 -
Treasury stock acquired (2.6) - -
Balance, end of year 1,005.5 1,003.9 769.0
Summary of changes in equity from nonowner sources
Net income (loss) $ 1,696.0 $ (27.0) $ 1,065.4
Other changes in equity from nonowner sources, net of tax 428.9 415.2 (180.4)
Total changes in equity from nonowner sources $ 2,124.9 $ 388.2 $ 885.0
(1) Includes foreign currency translation adjustments, changes in value of private equity securities and the cumulative effect of the change in
accounting for derivative instruments.
See notes to consolidated financial statements.