Travelers 2003 Annual Report Download - page 14
Download and view the complete annual report
Please find page 14 of the 2003 Travelers annual report below. You can navigate through the pages in the report by either clicking on the pages listed below, or by using the keyword search tool below to find specific information within the annual report.-
 1
1 -
2
-
3
-
 4
4 -
 5
5 -
 6
6 -
 7
7 -
 8
8 -
 9
9 -
 10
10 -
 11
11 -
 12
12 -
 13
13 -
 14
14 -
 15
15 -
 16
16 -
 17
17 -
 18
18 -
 19
19 -
 20
20 -
 21
21 -
 22
22 -
 23
23 -
 24
24 -
25
-
26
-
27
-
28
-
29
-
30
-
31
-
32
-
33
-
34
-
35
-
36
-
37
-
38
-
39
-
40
-
41
-
42
-
43
-
44
-
45
-
46
-
47
-
48
-
49
-
50
-
51
-
52
-
53
-
54
-
55
-
56
-
57
-
58
-
59
-
60
-
61
-
62
-
63
-
64
-
65
-
66
-
67
-
68
-
69
-
70
-
71
-
72
-
73
-
74
-
75
-
76
-
77
-
78
-
79
-
80
-
81
-
82
-
83
-
84
-
85
-
86
-
87
-
88
-
89
-
90
-
91
-
92
-
93
-
94
-
95
-
96
-
97
-
98
-
99
-
100
-
101
-
102
-
103
-
104
-
105
-
106
-
107
-
108
-
109
-
110
-
111
-
112
-
113
-
114
-
115
-
116
-
117
-
118
-
119
-
120
-
121
-
122
-
123
-
124
-
125
-
126
-
127
-
128
-
129
-
130
-
131
-
132
-
133
-
134
-
135
-
136
-
137
-
138
-
139
-
140
-
141
-
142
-
143
-
144
-
145
-
146
-
147
-
148
-
149
-
150
-
151
-
152
-
153
-
154
-
155
-
156
 |
 |

12
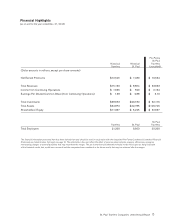
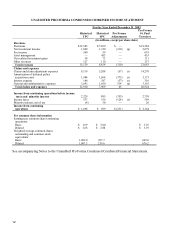
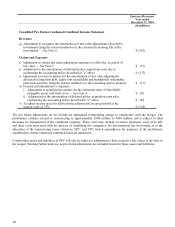
UNAUDITED PRO FORMA CONDENSED COMBINED INCOME STATEMENT
For the Year Ended December 31, 2003
Historical
TPC
Historical
SPC
Pro Forma
Adjustments
Pro Forma
St. Paul
Travelers
(in millions, except per share data)
Revenues
Premiums
$ 12,545
$ 7,039
$ —
$ 19,584
Net investment income 1,869 1,120 (310) (q) 2,679
Fee income 560 59 — 619
Asset management — 453 — 453
Net realized investment gains 38 73 — 111
Other revenues 127 110 — 237
Total revenues 15,139 8,854 (310) 23,683
Claims and expenses
Claims and claim adjustment expenses
9,119
5,208
(57)
(r)
14,270
Amortization of deferred policy
acquisition costs
1,984
1,564
(375)
(s)
3,173
Interest expense 166 187 (37) (t) 316
General and administrative expenses 1,641 1,010 514 (u) 3,165
Total claims and expenses 12,910 7,969 45 20,924
Income from continuing operations before income
taxes and minority interest
2,229
885
(355)
2,759
Income taxes 537 156 (124) (v) 569
Minority interest, net of tax (4) 30 — 26
Income from continuing
operations
$ 1,696
$ 699
$ (231)
$ 2,164
Per common share information
Earnings per common share-continuing
operations:
Basic $ 1.69 $ 3.00 $ 3.25
Diluted $ 1.68 $ 2.88 $ 3.19
Weighted average common shares
outstanding and common stock
equivalents:
Basic 1,002.0 227.7 662.0
Diluted 1,007.3 239.6 676.2
See accompanying Notes to the Unaudited Pro Forma Condensed Combined Financial Statements.