Travelers 2003 Annual Report Download - page 30
Download and view the complete annual report
Please find page 30 of the 2003 Travelers annual report below. You can navigate through the pages in the report by either clicking on the pages listed below, or by using the keyword search tool below to find specific information within the annual report.-
 1
1 -
2
-
3
-
4
-
5
-
6
-
7
-
8
-
9
-
10
-
11
-
12
-
13
-
14
-
15
-
16
-
17
-
18
-
19
-
 20
20 -
 21
21 -
 22
22 -
 23
23 -
 24
24 -
 25
25 -
 26
26 -
 27
27 -
 28
28 -
 29
29 -
 30
30 -
 31
31 -
 32
32 -
 33
33 -
 34
34 -
 35
35 -
 36
36 -
 37
37 -
 38
38 -
 39
39 -
 40
40 -
41
-
42
-
43
-
44
-
45
-
46
-
47
-
48
-
49
-
50
-
51
-
52
-
53
-
54
-
55
-
56
-
57
-
58
-
59
-
60
-
61
-
62
-
63
-
64
-
65
-
66
-
67
-
68
-
69
-
70
-
71
-
72
-
73
-
74
-
75
-
76
-
77
-
78
-
79
-
80
-
81
-
82
-
83
-
84
-
85
-
86
-
87
-
88
-
89
-
90
-
91
-
92
-
93
-
94
-
95
-
96
-
97
-
98
-
99
-
100
-
101
-
102
-
103
-
104
-
105
-
106
-
107
-
108
-
109
-
110
-
111
-
112
-
113
-
114
-
115
-
116
-
117
-
118
-
119
-
120
-
121
-
122
-
123
-
124
-
125
-
126
-
127
-
128
-
129
-
130
-
131
-
132
-
133
-
134
-
135
-
136
-
137
-
138
-
139
-
140
-
141
-
142
-
143
-
144
-
145
-
146
-
147
-
148
-
149
-
150
-
151
-
152
-
153
-
154
-
155
-
156
 |
 |

28
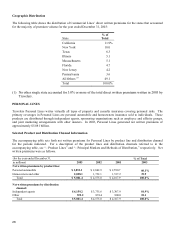
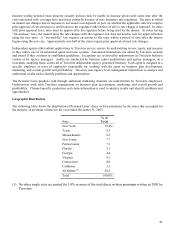
Geographic Distribution
The following table shows the distribution of Commercial Lines’ direct written premiums for the states that accounted
for the majority of premium volume for the year ended December 31, 2003:
State
% of
Total
California 11.9%
New York 10.0
Texas 6.3
Illinois 5.1
Massachusetts 5.1
Florida 4.7
New Jersey 4.2
Pennsylvania 3.6
All Others (1) 49.1
Total 100.0%
(1) No other single state accounted for 3.0% or more of the total direct written premiums written in 2003 by
Travelers.
PERSONAL LINES
Travelers Personal Lines writes virtually all types of property and casualty insurance covering personal risks. The
primary coverages in Personal Lines are personal automobile and homeowners insurance sold to individuals. These
products are distributed through independent agents, sponsoring organizations such as employee and affinity groups,
and joint marketing arrangements with other insurers. In 2003, Personal Lines generated net written premiums of
approximately $5.081 billion.
Selected Product and Distribution Channel Information
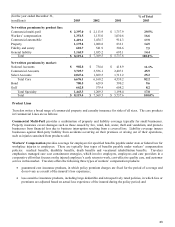
The accompanying table sets forth net written premiums for Personal Lines by product line and distribution channel
for the periods indicated. For a description of the product lines and distribution channels referred to in the
accompanying table, see “– Product Lines” and “– Principal Markets and Methods of Distribution,” respectively. Net
written premiums were as follows.
(for the year ended December 31, % of Total
in millions) 2003 2002 2001 2003
Net written premiums by product line:
Personal automobile $ 3,053.3 $ 2,842.9 $ 2,590.7 60.1%
Homeowners and other 2,028.1 1,732.1 1,517.2 39.9
Total
$ 5,081.4 $ 4,575.0 $ 4,107.9 100.0%
Net written premiums b
y
distribution
channel:
Independent agents $ 4,159.2 $ 3,735.6 $ 3,307.9 81.9%
Othe
r
922.2 839.4 800.0 18.1
Total $ 5,081.4 $ 4,575.0 $ 4,107.9 100.0%