Travelers 2003 Annual Report Download - page 65
Download and view the complete annual report
Please find page 65 of the 2003 Travelers annual report below. You can navigate through the pages in the report by either clicking on the pages listed below, or by using the keyword search tool below to find specific information within the annual report.-
 1
1 -
2
-
3
-
4
-
5
-
6
-
7
-
8
-
9
-
10
-
11
-
12
-
13
-
14
-
15
-
16
-
17
-
18
-
19
-
20
-
21
-
22
-
23
-
24
-
25
-
26
-
27
-
28
-
29
-
30
-
31
-
32
-
33
-
34
-
35
-
36
-
37
-
38
-
39
-
40
-
41
-
42
-
43
-
44
-
45
-
46
-
47
-
48
-
49
-
50
-
51
-
52
-
53
-
54
-
 55
55 -
 56
56 -
 57
57 -
 58
58 -
 59
59 -
 60
60 -
 61
61 -
 62
62 -
 63
63 -
 64
64 -
 65
65 -
 66
66 -
 67
67 -
 68
68 -
 69
69 -
 70
70 -
 71
71 -
 72
72 -
 73
73 -
 74
74 -
 75
75 -
76
-
77
-
78
-
79
-
80
-
81
-
82
-
83
-
84
-
85
-
86
-
87
-
88
-
89
-
90
-
91
-
92
-
93
-
94
-
95
-
96
-
97
-
98
-
99
-
100
-
101
-
102
-
103
-
104
-
105
-
106
-
107
-
108
-
109
-
110
-
111
-
112
-
113
-
114
-
115
-
116
-
117
-
118
-
119
-
120
-
121
-
122
-
123
-
124
-
125
-
126
-
127
-
128
-
129
-
130
-
131
-
132
-
133
-
134
-
135
-
136
-
137
-
138
-
139
-
140
-
141
-
142
-
143
-
144
-
145
-
146
-
147
-
148
-
149
-
150
-
151
-
152
-
153
-
154
-
155
-
156
 |
 |

63
any cash distributions. Certain other private equity investments which are not subject to the provisions of FAS 115 are
reported at fair value.
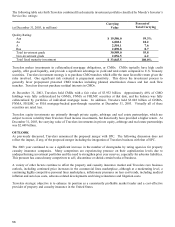
The following is a summary of the approximate carrying value of Travelers non-publicly traded securities:
(in millions) Carrying Value
Real estate partnerships and joint ventures $ 239.5
Investment partnerships, including hedge funds 1,769.8
Equity investments 439.8
Fixed income securities 482.8
Total $ 2,931.9
The following table summarizes for all fixed maturities and equity securities available for sale for which fair value is
less than 80% of amortized cost at December 31, 2003, the gross unrealized investment loss by length of time those
securities have continuously been in an unrealized loss position:
Period For Which Fair Value Is Less Than 80% of Amortized Cost
(in millions)
Less Than
3 Months
Greater
Than
3 Months
Less Than
6 Months
Greater
Than
6 Months
Less Than
12 Months
Greater
Than
12 Months
Total
Fixed maturities $ 3.5 $ - $ 1.9 $ - $ 5.4
E
q
uit
y
securities ---- -
Total $ 3.5 $ - $ 1.9 $ - $ 5.4
Travelers believes that the prices of the securities identified above were temporarily depressed primarily as a result of
market dislocation and generally poor cyclical economic conditions. Further, unrealized losses as of December 31,
2003 represent less than 1% of the portfolio, and, therefore, any impact on Travelers financial position would not be
significant.
At December 31, 2003, non-investment grade securities comprised 6% of Travelers fixed income investment portfolio.
Included in those categories at December 31, 2003 were securities in an unrealized loss position that, in the aggregate,
had an amortized cost of $251.3 million and a fair value of $232.1 million, resulting in a net pretax unrealized loss of
$19.2 million.
These securities in an unrealized loss position represented less than 1% of the total amortized cost and less than 1% of
the fair value of the fixed income portfolio at December 31, 2003, and accounted for 13% of the total pretax unrealized
loss in the fixed income portfolio.
No individual security had a greater than $2.0 million unrealized loss as of December 31, 2003.
Following are the pretax realized losses on investments sold during the year ended December 31, 2003:
(in millions) Loss Fair Value
Fixed maturities $ 147.2 $ 3,776.1
Equity securities 9.2 72.0
Other 14.8 3.6
Total $ 171.2 $ 3,851.7
Resulting purchases and sales of investments are based on cash requirements, the characteristics of the insurance
liabilities and current market conditions. Travelers identifies investments to be sold to achieve its primary investment