Travelers 2003 Annual Report Download - page 47
Download and view the complete annual report
Please find page 47 of the 2003 Travelers annual report below. You can navigate through the pages in the report by either clicking on the pages listed below, or by using the keyword search tool below to find specific information within the annual report.-
 1
1 -
2
-
3
-
4
-
5
-
6
-
7
-
8
-
9
-
10
-
11
-
12
-
13
-
14
-
15
-
16
-
17
-
18
-
19
-
20
-
21
-
22
-
23
-
24
-
25
-
26
-
27
-
28
-
29
-
30
-
31
-
32
-
33
-
34
-
35
-
36
-
 37
37 -
 38
38 -
 39
39 -
 40
40 -
 41
41 -
 42
42 -
 43
43 -
 44
44 -
 45
45 -
 46
46 -
 47
47 -
 48
48 -
 49
49 -
 50
50 -
 51
51 -
 52
52 -
 53
53 -
 54
54 -
 55
55 -
 56
56 -
 57
57 -
58
-
59
-
60
-
61
-
62
-
63
-
64
-
65
-
66
-
67
-
68
-
69
-
70
-
71
-
72
-
73
-
74
-
75
-
76
-
77
-
78
-
79
-
80
-
81
-
82
-
83
-
84
-
85
-
86
-
87
-
88
-
89
-
90
-
91
-
92
-
93
-
94
-
95
-
96
-
97
-
98
-
99
-
100
-
101
-
102
-
103
-
104
-
105
-
106
-
107
-
108
-
109
-
110
-
111
-
112
-
113
-
114
-
115
-
116
-
117
-
118
-
119
-
120
-
121
-
122
-
123
-
124
-
125
-
126
-
127
-
128
-
129
-
130
-
131
-
132
-
133
-
134
-
135
-
136
-
137
-
138
-
139
-
140
-
141
-
142
-
143
-
144
-
145
-
146
-
147
-
148
-
149
-
150
-
151
-
152
-
153
-
154
-
155
-
156
 |
 |

45
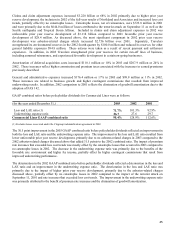
Claims and claim adjustment expenses increased $3.220 billion or 68% in 2002 primarily due to higher prior year
reserve development, the inclusion in 2002 of the full-year results of Northland and Associates and increased loss cost
trends, partially offset by no catastrophe losses. Catastrophe losses, net of reinsurance, were $723.8 million in 2001
and were primarily due to the $644.0 million of losses attributed to the terrorist attack on September 11 as well as the
Seattle earthquake and Tropical Storm Allison. Included in claims and claim adjustment expenses in 2002 was
unfavorable prior year reserve development of $3.118 billion compared to 2001 favorable prior year reserve
development of $28.4 million. As discussed above, the most significant component in 2002 prior year reserve
development was asbestos-related charges which increased $2.756 billion over 2001. Separately, Travelers
strengthened its environmental reserves in the 2002 fourth quarter by $100.0 million and reduced its reserves for other
general liability exposures $94.8 million. These actions were taken as a result of recent payment and settlement
experience. In addition, in 2003 Travelers strengthened prior year reserves for certain run-off lines of business,
including assumed reinsurance, and experienced favorable development in certain on-going businesses.
Amortization of deferred acquisition costs increased $110.1 million or 10% in 2003 and $207.9 million or 24% in
2002. These increases reflect higher commission and premium taxes associated with the increases in earned premiums
previously described.
General and administrative expenses increased $176.4 million or 17% in 2003 and $98.8 million or 11% in 2002.
These increases are related to business growth and higher contingent commissions that resulted from improved
underwriting results. In addition, 2002 comparison to 2001 reflects the elimination of goodwill amortization due to the
adoption of FAS 142.
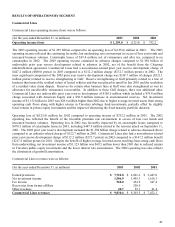
GAAP combined ratios before policyholder dividends for Commercial Lines were as follows:
(
for the
y
ear ended December 31,
)
2003 2002 2001
Loss and LAE ratio
(
1
)
71.7% 101.3% 82.9%
Underwritin
g
ex
p
ense ratio 26.7 27.6 29.7
Commercial Lines GAAP combined ratio 98.4% 128.9% 112.6%
(1) Excludes losses recovered under the Citigroup indemnification agreement in 2002.
The 30.5 point improvement in the 2003 GAAP combined ratio before policyholder dividends reflected an improvement in
both the loss and LAE ratio and the underwriting expense ratio. The improvement in the loss and LAE ratio resulted from
lower unfavorable prior year reserve development, primarily due to no asbestos-related charges in 2003 compared to the
2002 asbestos-related charges discussed above that added 31.5 points to the 2002 combined ratio. The impact of premium
rate increases that exceeded loss cost trends was mostly offset by the catastrophe losses that occurred in 2003 compared to
no catastrophe losses in 2002. The decrease in the underwriting expense ratio was primarily due to the benefits of the
favorable rate environment and higher fee income, partially offset by higher contingent commissions that result from
improved underwriting performance.
The deterioration in the 2002 GAAP combined ratio before policyholder dividends reflected a deterioration in the loss and
LAE ratio and an improvement in the underwriting expense ratio. The deterioration in the loss and LAE ratio was
primarily due to the impact of higher prior year reserve development, primarily due to the asbestos-related charges
discussed above, partially offset by no catastrophe losses in 2002 compared to the impact of the terrorist attack on
September 11, 2001 and rate increases that exceeded loss cost trends. The improvement in the underwriting expense ratio
was primarily attributed to the benefit of premium rate increases and the elimination of goodwill amortization.