Travelers 2003 Annual Report Download - page 115
Download and view the complete annual report
Please find page 115 of the 2003 Travelers annual report below. You can navigate through the pages in the report by either clicking on the pages listed below, or by using the keyword search tool below to find specific information within the annual report.-
 1
1 -
2
-
3
-
4
-
5
-
6
-
7
-
8
-
9
-
10
-
11
-
12
-
13
-
14
-
15
-
16
-
17
-
18
-
19
-
20
-
21
-
22
-
23
-
24
-
25
-
26
-
27
-
28
-
29
-
30
-
31
-
32
-
33
-
34
-
35
-
36
-
37
-
38
-
39
-
40
-
41
-
42
-
43
-
44
-
45
-
46
-
47
-
48
-
49
-
50
-
51
-
52
-
53
-
54
-
55
-
56
-
57
-
58
-
59
-
60
-
61
-
62
-
63
-
64
-
65
-
66
-
67
-
68
-
69
-
70
-
71
-
72
-
73
-
74
-
75
-
76
-
77
-
78
-
79
-
80
-
81
-
82
-
83
-
84
-
85
-
86
-
87
-
88
-
89
-
90
-
91
-
92
-
93
-
94
-
95
-
96
-
97
-
98
-
99
-
100
-
101
-
102
-
103
-
104
-
 105
105 -
 106
106 -
 107
107 -
 108
108 -
 109
109 -
 110
110 -
 111
111 -
 112
112 -
 113
113 -
 114
114 -
 115
115 -
 116
116 -
 117
117 -
 118
118 -
 119
119 -
 120
120 -
 121
121 -
 122
122 -
 123
123 -
 124
124 -
 125
125 -
126
-
127
-
128
-
129
-
130
-
131
-
132
-
133
-
134
-
135
-
136
-
137
-
138
-
139
-
140
-
141
-
142
-
143
-
144
-
145
-
146
-
147
-
148
-
149
-
150
-
151
-
152
-
153
-
154
-
155
-
156
 |
 |

113
NOTES TO CONSOLIDATED FINANCIAL STATEMENTS
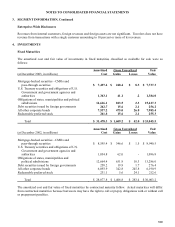
4. INVESTMENTS, Continued
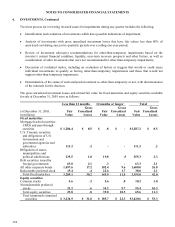
Impairment charges included in net realized investment gains (losses) were as follows:
(for the year ended December 31, in millions) 2003 2002 2001
Fixed maturities $ 65.4 $ 255.0 $ 109.7
Equity securities 5.9 8.5 35.8
Real estate and other 18.9 20.6 .7
Total $ 90.2 $ 284.1 $ 146.2
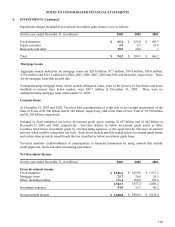
Mortgage Loans
Aggregate annual maturities on mortgage loans are $28.8 million, $7.7 million, $14.4 million, $38.6 million,
$19.8 million and $101.5 million for 2004, 2005, 2006, 2007, 2008 and 2009 and thereafter, respectively. There
are no mortgage loans that are past due.
Underperforming mortgage loans, which include delinquent loans, loans in the process of foreclosure and loans
modified at interest rates below market, were $30.7 million at December 31, 2003. There were no
underperforming mortgage loans at December 31, 2002.
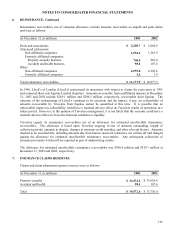
Concentrations
At December 31, 2003 and 2002, Travelers had concentrations of credit risk in tax-exempt investments of the
State of Texas of $1.540 billion and $1.386 billion, respectively, and of the State of New York of $1.350 billion
and $1.269 billion, respectively.
Included in fixed maturities are below investment grade assets totaling $2.057 billion and $1.945 billion at
December 31, 2003 and 2002, respectively. Travelers defines its below investment grade assets as those
securities rated below investment grade by external rating agencies, or the equivalent by Travelers investment
advisors when a public rating does not exist. Such assets include publicly traded below investment grade bonds
and certain other privately issued bonds that are classified as below investment grade loans.
Travelers monitors creditworthiness of counterparties to financial instruments by using controls that include
credit approvals, limits and other monitoring procedures.
Net Investment Income
(for the year ended December 31, in millions) 2003 2002 2001
Gross investment income
Fixed maturities $ 1,526.6 $ 1,629.8 $ 1,657.3
Mortgage loans 25.7 26.8 28.3
Other, including trading 371.4 280.6 394.6
1,923.7 1,937.2 2,080.2
Investment expenses 54.9 56.7 46.2
Net investment income $ 1,868.8 $ 1,880.5 $ 2,034.0