Travelers 2003 Annual Report Download - page 48
Download and view the complete annual report
Please find page 48 of the 2003 Travelers annual report below. You can navigate through the pages in the report by either clicking on the pages listed below, or by using the keyword search tool below to find specific information within the annual report.-
 1
1 -
2
-
3
-
4
-
5
-
6
-
7
-
8
-
9
-
10
-
11
-
12
-
13
-
14
-
15
-
16
-
17
-
18
-
19
-
20
-
21
-
22
-
23
-
24
-
25
-
26
-
27
-
28
-
29
-
30
-
31
-
32
-
33
-
34
-
35
-
36
-
37
-
 38
38 -
 39
39 -
 40
40 -
 41
41 -
 42
42 -
 43
43 -
 44
44 -
 45
45 -
 46
46 -
 47
47 -
 48
48 -
 49
49 -
 50
50 -
 51
51 -
 52
52 -
 53
53 -
 54
54 -
 55
55 -
 56
56 -
 57
57 -
 58
58 -
59
-
60
-
61
-
62
-
63
-
64
-
65
-
66
-
67
-
68
-
69
-
70
-
71
-
72
-
73
-
74
-
75
-
76
-
77
-
78
-
79
-
80
-
81
-
82
-
83
-
84
-
85
-
86
-
87
-
88
-
89
-
90
-
91
-
92
-
93
-
94
-
95
-
96
-
97
-
98
-
99
-
100
-
101
-
102
-
103
-
104
-
105
-
106
-
107
-
108
-
109
-
110
-
111
-
112
-
113
-
114
-
115
-
116
-
117
-
118
-
119
-
120
-
121
-
122
-
123
-
124
-
125
-
126
-
127
-
128
-
129
-
130
-
131
-
132
-
133
-
134
-
135
-
136
-
137
-
138
-
139
-
140
-
141
-
142
-
143
-
144
-
145
-
146
-
147
-
148
-
149
-
150
-
151
-
152
-
153
-
154
-
155
-
156
 |
 |

46
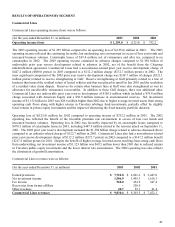
Personal Lines
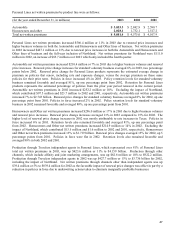
Personal Lines operating income was as follows:
(for the year ended December 31, in millions) 2003 2002 2001
Operating income $ 492.5 $ 346.9 $ 241.0
The 2003 operating income increased $145.6 million or 42%. Operating income benefited from the favorable but
moderating premium rate environment in both automobile and property, increased business volumes and a continued
moderation in the increase in loss costs. Operating income in 2003 included catastrophe losses of $161.6 million
compared to $54.7 million in 2002. Also impacting operating income was favorable prior year reserve development in
2003 of $137.8 million ($212.0 million pretax) compared to $19.4 million ($29.9 million pretax) in 2002. Favorable
prior year reserve development in 2003 resulted from improvement in non-catastrophe-related claim frequency for
both homeowners and non-bodily-injury automobile businesses and a $32.5 million ($50.0 million pretax) reduction in
the reserves held related to the terrorist attack on September 11 also due to lower than expected claim frequency.
Despite the benefit of higher average invested assets resulting from strong cash flows from operations, 2003 after tax
net investment income of $262.7 million was $16.1 million lower than 2002 reflecting the lower interest rate
environment, slightly lower returns in Travelers private equity investments and the impact of shortening the fixed
maturity portfolio duration.
Operating income in 2002 increased $105.9 million or 44%. The 2002 operating income reflected an improved
premium rate environment in both auto and property and a moderation in the increase in loss costs. Operating income
in 2001 reflected the $41.6 million impact of the terrorist attack on September 11, 2001. Weather-related catastrophe
losses of $54.7 million in 2002 compared to $44.5 million in 2001. Favorable reserve development of $19.4 million
($29.9 million pretax) in 2002 primarily related to the moderation in loss cost trends in automobile. Despite the
benefit of higher average invested assets resulting from strong cash flows from operations, 2002 after tax net
investment income of $278.8 million was $15.4 million lower than 2001 reflecting reduced returns in Travelers public
equity investments and the lower interest rate environment. The elimination of goodwill amortization also contributed
to the increase in 2002 operating income.
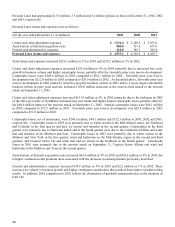
Personal Lines revenues were as follows:
(for the year ended December 31, in millions) 2003 2002 2001
Earned
p
remiums $ 4,822.6 $ 4,354.1 $ 3,963.9
N
et investment income 361.1 384.7 410.2
Other revenues 85.2 80.1 73.3
Personal Lines revenues $ 5,268.9 $ 4,818.9 $ 4,447.4
Revenues increased $450.0 million or 9% in 2003 and $371.5 million or 8% in 2002.
Earned premiums increased $468.5 million or 11% in 2003 primarily due to higher rates as well as increased new business
volumes and strong retention. Earned premiums in 2002 increased $390.2 million or 10% primarily due to rate increases
in all product lines and the full-year inclusion of Northland. Earned premiums for Northland were $112.1 million in 2002,
an increase of $91.2 million over 2001 which only included the fourth quarter.
Net investment income decreased $23.6 million in 2003 and $25.5 million in 2002 despite higher average invested
assets resulting from strong cash flows from operations. The decline resulted from a reduction in investment yields to
5.3% in 2003 from 6.0% in 2002. The decrease in yields reflected the lower interest rate environment, the shortening
of the average effective duration of the fixed maturity portfolio and a higher proportion of tax-exempt investments.
The 2002 decline resulted from a reduction in investment yields to 6.0% from 6.9% in 2001. The decrease in yields
reflected reduced returns in Travelers public equity investments and the lower interest rate environment.