Travelers 2003 Annual Report Download - page 88
Download and view the complete annual report
Please find page 88 of the 2003 Travelers annual report below. You can navigate through the pages in the report by either clicking on the pages listed below, or by using the keyword search tool below to find specific information within the annual report.-
 1
1 -
2
-
3
-
4
-
5
-
6
-
7
-
8
-
9
-
10
-
11
-
12
-
13
-
14
-
15
-
16
-
17
-
18
-
19
-
20
-
21
-
22
-
23
-
24
-
25
-
26
-
27
-
28
-
29
-
30
-
31
-
32
-
33
-
34
-
35
-
36
-
37
-
38
-
39
-
40
-
41
-
42
-
43
-
44
-
45
-
46
-
47
-
48
-
49
-
50
-
51
-
52
-
53
-
54
-
55
-
56
-
57
-
58
-
59
-
60
-
61
-
62
-
63
-
64
-
65
-
66
-
67
-
68
-
69
-
70
-
71
-
72
-
73
-
74
-
75
-
76
-
77
-
 78
78 -
 79
79 -
 80
80 -
 81
81 -
 82
82 -
 83
83 -
 84
84 -
 85
85 -
 86
86 -
 87
87 -
 88
88 -
 89
89 -
 90
90 -
 91
91 -
 92
92 -
 93
93 -
 94
94 -
 95
95 -
 96
96 -
 97
97 -
 98
98 -
99
-
100
-
101
-
102
-
103
-
104
-
105
-
106
-
107
-
108
-
109
-
110
-
111
-
112
-
113
-
114
-
115
-
116
-
117
-
118
-
119
-
120
-
121
-
122
-
123
-
124
-
125
-
126
-
127
-
128
-
129
-
130
-
131
-
132
-
133
-
134
-
135
-
136
-
137
-
138
-
139
-
140
-
141
-
142
-
143
-
144
-
145
-
146
-
147
-
148
-
149
-
150
-
151
-
152
-
153
-
154
-
155
-
156
 |
 |

86
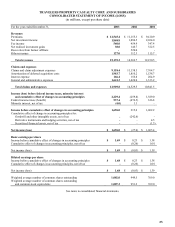
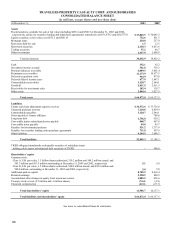
TRAVELERS PROPERTY CASUALTY CORP. AND SUBSIDIARIES
CONSOLIDATED BALANCE SHEET
(in millions, except shares and per share data)
At December 31, 2003 2002
Assets
Fixed maturities, available for sale at fair value (including $696.4 and $580.5 at December 31, 2003 and 2002,
respectively, subject to securities lending and repurchase agreements) (amortized cost $31,478.3 and $28,877.8)
$ 33,045.5
$ 30,003.2
Equity securities, at fair value (cost $672.3 and $861.9) 732.6 851.5
Mortgage loans 210.8 257.9
Real estate held for sale 1.5 12.5
Short-term securities 2,138.3 4,853.6
Trading securities 57.2 40.7
Other investments 2,467.0 2,405.8
Total investments 38,652.9 38,425.2
Cash 352.1 92.2
Investment income accrued 361.8 339.3
Premium balances receivable 4,089.5 3,861.4
Reinsurance recoverables 11,173.9 10,977.5
Deferred acquisition costs 964.9 873.0
Deferred federal income taxes 677.9 1,447.1
Contractholder receivables 3,120.7 2,544.1
Goodwill 2,411.5 2,411.5
Receivables for investment sales 182.4 138.7
Other assets 2,884.4 3,027.5
Total assets $ 64,872.0 $ 64,137.5
Liabilities
Claims and claim adjustment expense reserves $ 34,572.6 $ 33,736.0
Unearned premium reserves 7,110.8 6,459.9
Contractholder payables 3,120.7 2,544.1
Notes payable to former affiliates - 700.0
Long-term debt 1,756.0 926.2
Convertible junior subordinated notes payable 868.7 867.8
Convertible notes payable 49.8 49.7
Payables for investment purchases 531.2 3,737.9
Payables for securities lending and repurchase agreements 711.0 597.9
Other liabilities 4,164.5 3,480.7
Total liabilities 52,885.3 53,100.2
TIGHI-obligated mandatorily redeemable securities of subsidiary trusts
holding solely junior subordinated debt securities of TIGHI - 900.0
Shareholders’ equity
Common stock:
Class A, $.01 par value, 1.5 billion shares authorized, 510.2 million and 504.2 million issued, and
505.7 million and 503.9 million outstanding at December 31, 2003 and 2002, respectively 5.1 5.0
Class B, $.01 par value, 1.5 billion shares authorized, 500.0 million issued, and 499.8 million and
500.0 million outstanding at December 31, 2003 and 2002, respectively 5.0 5.0
Additional paid-in capital 8,705.2 8,618.4
Retained earnings 2,290.2 880.5
Accumulated other changes in equity from nonowner sources 1,085.5 656.6
Treasury stock, at cost (4.7 million and .3 million shares) (74.4) (4.9)
Unearned compensation (29.9) (23.3)
Total shareholders’ equity 11,986.7 10,137.3
Total liabilities and shareholders’ equity $ 64,872.0 $ 64,137.5
See notes to consolidated financial statements.