Travelers 2003 Annual Report Download - page 112
Download and view the complete annual report
Please find page 112 of the 2003 Travelers annual report below. You can navigate through the pages in the report by either clicking on the pages listed below, or by using the keyword search tool below to find specific information within the annual report.-
 1
1 -
2
-
3
-
4
-
5
-
6
-
7
-
8
-
9
-
10
-
11
-
12
-
13
-
14
-
15
-
16
-
17
-
18
-
19
-
20
-
21
-
22
-
23
-
24
-
25
-
26
-
27
-
28
-
29
-
30
-
31
-
32
-
33
-
34
-
35
-
36
-
37
-
38
-
39
-
40
-
41
-
42
-
43
-
44
-
45
-
46
-
47
-
48
-
49
-
50
-
51
-
52
-
53
-
54
-
55
-
56
-
57
-
58
-
59
-
60
-
61
-
62
-
63
-
64
-
65
-
66
-
67
-
68
-
69
-
70
-
71
-
72
-
73
-
74
-
75
-
76
-
77
-
78
-
79
-
80
-
81
-
82
-
83
-
84
-
85
-
86
-
87
-
88
-
89
-
90
-
91
-
92
-
93
-
94
-
95
-
96
-
97
-
98
-
99
-
100
-
101
-
 102
102 -
 103
103 -
 104
104 -
 105
105 -
 106
106 -
 107
107 -
 108
108 -
 109
109 -
 110
110 -
 111
111 -
 112
112 -
 113
113 -
 114
114 -
 115
115 -
 116
116 -
 117
117 -
 118
118 -
 119
119 -
 120
120 -
 121
121 -
 122
122 -
123
-
124
-
125
-
126
-
127
-
128
-
129
-
130
-
131
-
132
-
133
-
134
-
135
-
136
-
137
-
138
-
139
-
140
-
141
-
142
-
143
-
144
-
145
-
146
-
147
-
148
-
149
-
150
-
151
-
152
-
153
-
154
-
155
-
156
 |
 |

110
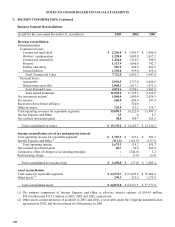
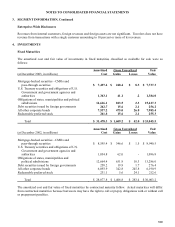
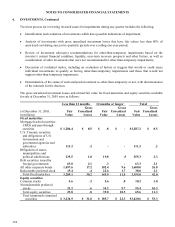
NOTES TO CONSOLIDATED FINANCIAL STATEMENTS
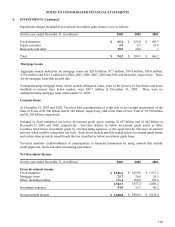
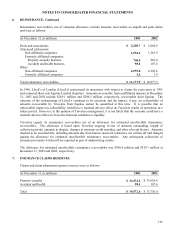
4. INVESTMENTS, Continued
Amortized Fair
(at December 31, 2003, in millions) Cost Value
Due in one year or less $ 1,282.4 $ 1,301.3
Due after 1 year through 5 years 5,047.4 5,256.2
Due after 5 years through 10 years 7,260.5 7,715.2
Due after 10 years 10,390.6 11,035.5
23,980.9 25,308.2
Mortgage-backed securities 7,497.4 7,737.3
Total $
31,478.3
$ 33,045.5
Travelers makes investments in collateralized mortgage obligations (CMOs). CMOs typically have high credit
quality, offer good liquidity, and provide a significant advantage in yield and total return compared to U.S.
Treasury securities. Travelers investment strategy is to purchase CMO tranches which offer the most favorable
return given the risks involved. One significant risk evaluated is prepayment sensitivity. This drives the
investment process to generally favor prepayment protected CMO tranches including planned amortization
classes and last cash flow tranches. Travelers does invest in other types of CMO tranches if a careful assessment
indicates a favorable risk/return tradeoff. Travelers does not purchase residual interests in CMOs.
At December 31, 2003 and 2002, Travelers held CMOs classified as available for sale with a fair value of $3.932
billion and $4.120 billion, respectively. Approximately 46% and 58% of Travelers CMO holdings are fully
collateralized by GNMA, FNMA or FHLMC securities at December 31, 2003 and 2002, respectively. In
addition, Travelers held $3.802 billion and $4.815 billion of GNMA, FNMA, FHLMC or FHA mortgage-backed
pass-through securities classified as available for sale at December 31, 2003 and 2002, respectively. Virtually
all of these securities are rated Aaa.
At December 31, 2003 and 2002, $561.6 million and $580.5 million, respectively, of securities were on loan for
which cash collateral was received. There were not any securities on loan under tri-party lending agreements at
December 31, 2003 and 2002. At December 31, 2003, $134.8 million of securities were subject to dollar-roll
repurchase agreements. There were not any securities subject to such agreements at December 31, 2002.
Proceeds from sales of fixed maturities classified as available for sale were $8.343 billion, $12.519 billion and
$14.469 billion in 2003, 2002 and 2001, respectively. Gross gains of $281.7 million, $570.9 million and
$599.3 million and gross losses of $147.2 million, $148.4 million and $158.6 million, respectively, were realized
on those sales.
At December 31, 2003 and 2002, TPC’s insurance subsidiaries had $2.373 billion and $2.052 billion,
respectively, of securities on deposit at financial institutions in certain states pursuant to the respective states’
insurance regulatory authorities.