Travelers 2003 Annual Report Download - page 39
Download and view the complete annual report
Please find page 39 of the 2003 Travelers annual report below. You can navigate through the pages in the report by either clicking on the pages listed below, or by using the keyword search tool below to find specific information within the annual report.-
 1
1 -
2
-
3
-
4
-
5
-
6
-
7
-
8
-
9
-
10
-
11
-
12
-
13
-
14
-
15
-
16
-
17
-
18
-
19
-
20
-
21
-
22
-
23
-
24
-
25
-
26
-
27
-
28
-
 29
29 -
 30
30 -
 31
31 -
 32
32 -
 33
33 -
 34
34 -
 35
35 -
 36
36 -
 37
37 -
 38
38 -
 39
39 -
 40
40 -
 41
41 -
 42
42 -
 43
43 -
 44
44 -
 45
45 -
 46
46 -
 47
47 -
 48
48 -
 49
49 -
50
-
51
-
52
-
53
-
54
-
55
-
56
-
57
-
58
-
59
-
60
-
61
-
62
-
63
-
64
-
65
-
66
-
67
-
68
-
69
-
70
-
71
-
72
-
73
-
74
-
75
-
76
-
77
-
78
-
79
-
80
-
81
-
82
-
83
-
84
-
85
-
86
-
87
-
88
-
89
-
90
-
91
-
92
-
93
-
94
-
95
-
96
-
97
-
98
-
99
-
100
-
101
-
102
-
103
-
104
-
105
-
106
-
107
-
108
-
109
-
110
-
111
-
112
-
113
-
114
-
115
-
116
-
117
-
118
-
119
-
120
-
121
-
122
-
123
-
124
-
125
-
126
-
127
-
128
-
129
-
130
-
131
-
132
-
133
-
134
-
135
-
136
-
137
-
138
-
139
-
140
-
141
-
142
-
143
-
144
-
145
-
146
-
147
-
148
-
149
-
150
-
151
-
152
-
153
-
154
-
155
-
156
 |
 |

37
Travelers discussions related to all items, other than net income (loss), are presented on a pretax basis, unless
otherwise noted.
Net income of $1.696 billion or $1.69 per share basic and $1.68 per share diluted in 2003 compared to a net loss of
$(27.0) million or $(0.03) per share, basic and diluted in 2002. Net income for 2003 reflected the continuing favorable,
but moderating, rate environment in excess of loss cost trends and lower unfavorable prior year reserve development,
partially offset by higher weather-related catastrophe losses in 2003. Catastrophe losses of $229.0 million, net of
reinsurance and after tax, in 2003 compared to $54.7 million in 2002. Net unfavorable prior year reserve development
in 2003 of $309.4 million, which included $338.7 of charges related to reserve strengthening at Gulf, compared to
$1.487 billion of unfavorable prior year reserve development in 2002, which included $1.394 billion of charges related
to asbestos reserve strengthening. In December 2002, Travelers strengthened its asbestos reserves to $3.404 billion,
after reinsurance recoverables, and fully utilized the $800.0 million pretax benefit under the Citigroup indemnification
agreement. For additional information see “-Asbestos Claims and Litigation.” After tax net investment income
increased $12.7 million from 2002 due to higher average invested assets resulting from strong cash flows from
operations in 2003, partially offset by the lower interest rate environment and the shortening of the fixed maturity
portfolio duration. Net income included $20.7 million of net realized investment gains compared to $99.0 million of
net realized investment gains in 2002. Net loss for 2002 included a charge for the cumulative effect of a change in
accounting principle of $242.6 million due to the adoption of Financial Accounting Standards Board (FASB)
Statement of Financial Accounting Standards No. 142, “Goodwill and Other Intangible Assets” (FAS 142).
Net loss of $(27.0) million in 2002 or $(0.03) per share, basic and diluted, compared to net income of $1.065 billion or
$1.39 per share, basic and diluted, in 2001. Results in 2002 benefited from the favorable rate environment that was
significantly in excess of loss cost trends and lower weather-related catastrophe losses of $54.7 million compared to
$67.1 million in 2001. The comparison to 2001 also benefited from the inclusion in 2001 of losses of $489.5 million
related to the terrorist attack on September 11th. Results in 2002 reflected unfavorable prior year reserve development
of $1.487 billion, which included the asbestos charge discussed above, compared to $38.7 million of favorable prior
year reserve development in 2001. After tax net investment income decreased $89.4 million or 6% in 2002 due to
reduced returns in Travelers public equity investments and the lower interest rate environment. Net income in 2002
was favorably impacted by the elimination of goodwill amortization and lower interest expense. Net realized
investment gains were $99.0 million and $209.9 million in 2002 and 2001, respectively, and the net loss for 2002
included a charge of $242.6 million due to the adoption of FAS 142.
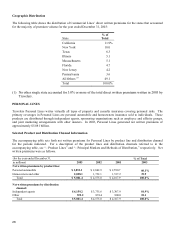
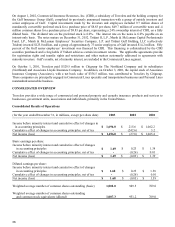
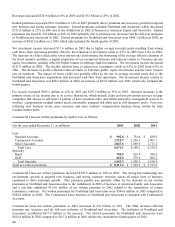
Consolidated revenues were as follows:
(for the year ended December 31, in millions) 2003 2002 2001
Earned
p
remiums $ 12,545.4 $ 11,155.3 $ 9,410.9
N
et investment income 1,868.8 1,880.5 2,034.0
Fee income 560.0 454.9 347.4
N
et realized investment
g
ains 38.0 146.7 322.5
Recoveries from former affiliate - 520.0 -
Other revenues 127.0 112.3 115.7
Consolidated revenues $ 15,139.2 $ 14,269.7 $ 12,230.5