Travelers 2003 Annual Report Download - page 51
Download and view the complete annual report
Please find page 51 of the 2003 Travelers annual report below. You can navigate through the pages in the report by either clicking on the pages listed below, or by using the keyword search tool below to find specific information within the annual report.-
 1
1 -
2
-
3
-
4
-
5
-
6
-
7
-
8
-
9
-
10
-
11
-
12
-
13
-
14
-
15
-
16
-
17
-
18
-
19
-
20
-
21
-
22
-
23
-
24
-
25
-
26
-
27
-
28
-
29
-
30
-
31
-
32
-
33
-
34
-
35
-
36
-
37
-
38
-
39
-
40
-
 41
41 -
 42
42 -
 43
43 -
 44
44 -
 45
45 -
 46
46 -
 47
47 -
 48
48 -
 49
49 -
 50
50 -
 51
51 -
 52
52 -
 53
53 -
 54
54 -
 55
55 -
 56
56 -
 57
57 -
 58
58 -
 59
59 -
 60
60 -
 61
61 -
62
-
63
-
64
-
65
-
66
-
67
-
68
-
69
-
70
-
71
-
72
-
73
-
74
-
75
-
76
-
77
-
78
-
79
-
80
-
81
-
82
-
83
-
84
-
85
-
86
-
87
-
88
-
89
-
90
-
91
-
92
-
93
-
94
-
95
-
96
-
97
-
98
-
99
-
100
-
101
-
102
-
103
-
104
-
105
-
106
-
107
-
108
-
109
-
110
-
111
-
112
-
113
-
114
-
115
-
116
-
117
-
118
-
119
-
120
-
121
-
122
-
123
-
124
-
125
-
126
-
127
-
128
-
129
-
130
-
131
-
132
-
133
-
134
-
135
-
136
-
137
-
138
-
139
-
140
-
141
-
142
-
143
-
144
-
145
-
146
-
147
-
148
-
149
-
150
-
151
-
152
-
153
-
154
-
155
-
156
 |
 |

49
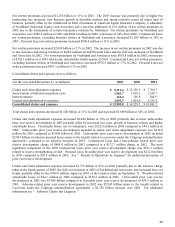
GAAP combined ratios for Personal Lines were as follows:
(
for the
y
ear ended December 31,
)
2003 2002 2001
Loss and LAE ratio 69.1% 73.6% 77.0%
Underwritin
g
ex
p
ense ratio 25.3 25.8 26.8
Personal Lines GAAP combined ratio 94.4% 99.4% 103.8%
The 5.0 point improvement in the 2003 GAAP combined ratio reflected an improvement in both the loss and LAE ratio
and in the underwriting expense ratio. The improvement in the loss and LAE ratio was due to renewal price increases
that exceeded loss cost trends, continued reduced levels of non-catastrophe property claim frequency and higher
favorable prior year reserve development, partially offset by higher catastrophes. The improvement in the
underwriting expense ratio was primarily due to the benefits of the favorable rate environment and further expense
leverage.
The 4.4 point improvement in the 2002 GAAP combined ratio reflected an improvement in both the loss and LAE ratio
and the underwriting expense ratio. The improvement in the loss and LAE ratio was primarily attributed to renewal
price increases that exceeded loss cost trends, slightly higher natural catastrophes in 2002, the impact in 2001 of the
terrorist attack on September 11, and slightly lower favorable prior year reserve development. The improvement in
the underwriting expense ratio was primarily attributed to the benefit of premium rate increases and the elimination of
goodwill amortization. An increase in contingent commissions, resulting from the improved underwriting
performance, offset an overall reduction in other expenses.
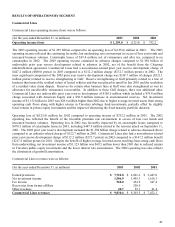
Interest Expense and Other
(for the year ended December 31, in millions) 2003 2002 2001
Revenues $1.9
$ 0.6 $ 8.5
Interest Ex
p
ense and Other, ne
t
$
(
112.2
)
$
(
102.9
)
$
(
137.5
)
Interest Expense and Other in 2003 increased $9.3 million, after tax, primarily due to higher interest costs. After tax
interest expense was $104.9 million in 2003 compared to $99.6 million in 2002. The increase in interest expense in
2003 was primarily due to certain one time costs associated with the first and second quarter refinancing activities that
lowered average interest costs and higher levels of temporary debt. Temporary financing included $550.0 million first
obtained in December 2002 in connection with the fourth quarter 2002 asbestos reserve strengthening and $1.400
billion of senior notes issued on March 11, 2003. The proceeds from the issuance of these senior notes were used to
prepay and refinance a $500.0 million note to Citigroup on March 11, 2003, and to redeem $900.0 million of trust
preferred securities on April 9, 2003. For additional information see “Liquidity and Capital Resources.”
After tax interest expense of $99.6 million in 2002 decreased $33.6 million from $133.2 million in 2001 due to lower
average interest-bearing debt levels primarily related to the repayment of debt obligations to Citigroup in the 2002 first
quarter. Included in 2001 net expense was the after tax benefit of a $5.7 million dividend from an investment that was
sold to Citigroup in 2002.