Travelers 2003 Annual Report Download - page 113
Download and view the complete annual report
Please find page 113 of the 2003 Travelers annual report below. You can navigate through the pages in the report by either clicking on the pages listed below, or by using the keyword search tool below to find specific information within the annual report.-
 1
1 -
2
-
3
-
4
-
5
-
6
-
7
-
8
-
9
-
10
-
11
-
12
-
13
-
14
-
15
-
16
-
17
-
18
-
19
-
20
-
21
-
22
-
23
-
24
-
25
-
26
-
27
-
28
-
29
-
30
-
31
-
32
-
33
-
34
-
35
-
36
-
37
-
38
-
39
-
40
-
41
-
42
-
43
-
44
-
45
-
46
-
47
-
48
-
49
-
50
-
51
-
52
-
53
-
54
-
55
-
56
-
57
-
58
-
59
-
60
-
61
-
62
-
63
-
64
-
65
-
66
-
67
-
68
-
69
-
70
-
71
-
72
-
73
-
74
-
75
-
76
-
77
-
78
-
79
-
80
-
81
-
82
-
83
-
84
-
85
-
86
-
87
-
88
-
89
-
90
-
91
-
92
-
93
-
94
-
95
-
96
-
97
-
98
-
99
-
100
-
101
-
102
-
 103
103 -
 104
104 -
 105
105 -
 106
106 -
 107
107 -
 108
108 -
 109
109 -
 110
110 -
 111
111 -
 112
112 -
 113
113 -
 114
114 -
 115
115 -
 116
116 -
 117
117 -
 118
118 -
 119
119 -
 120
120 -
 121
121 -
 122
122 -
 123
123 -
124
-
125
-
126
-
127
-
128
-
129
-
130
-
131
-
132
-
133
-
134
-
135
-
136
-
137
-
138
-
139
-
140
-
141
-
142
-
143
-
144
-
145
-
146
-
147
-
148
-
149
-
150
-
151
-
152
-
153
-
154
-
155
-
156
 |
 |

111
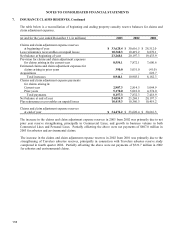
NOTES TO CONSOLIDATED FINANCIAL STATEMENTS
4. INVESTMENTS, Continued
Equity Securities
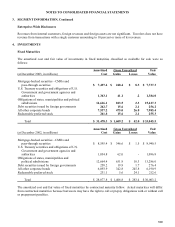
The cost and fair value of investments in equity securities were as follows:
Gross Unrealized Fair
(at December 31, 2003, in millions) Cost Gains Losses Value
Common stocks $ 70.9 $ 18.8 $ 1.0 $ 88.7
Nonredeemable preferred stocks 601.4 52.8 10.3 643.9
Total $ 672.3 $ 71.6 $ 11.3 $ 732.6
(at December 31, 2002, in millions)
Common stocks $ 57.4 $ 4.0 $ 11.3 $ 50.1
Nonredeemable preferred stocks 804.5 24.6 27.7 801.4
Total $ 861.9 $ 28.6 $ 39.0 $ 851.5
Proceeds from sales of equity securities were $254.1 million, $127.2 million and $469.7 million in 2003, 2002
and 2001, respectively, resulting in gross realized gains of $21.7 million, $18.1 million and $61.1 million and
gross realized losses of $9.2 million, $13.7 million and $33.4 million, respectively.
Impairments
An investment in a fixed maturity or equity security which is available for sale is impaired if its fair value falls
below its book value and the decline is considered to be other-than-temporary. Factors considered in
determining whether a decline is other-than-temporary include the length of time and the extent to which fair
value has been below cost; the financial condition and near-term prospects of the issuer; and Travelers ability
and intent to hold the investment for a period of time sufficient to allow for any anticipated recovery.
Additionally, for certain securitized financial assets with contractual cash flows (including asset-back securities),
EITF 99-20 requires Travelers to periodically update its best estimate of cash flows over the life of the security.
If management determines that the fair value of its securitized financial asset is less than its carrying amount and
there has been a decrease in the present value of the estimated cash flows since the last revised estimate,
considering both timing and amount, then an other-than-temporary impairment is recognized. A debt security is
impaired if it is probable that Travelers will not be able to collect all amounts due under the security’s
contractual terms. Equity investments are impaired when it becomes apparent that Travelers will not recover its
cost over the expected holding period. Further, for securities expected to be sold, an other-than-temporary
impairment charge is recognized if Travelers does not expect the fair value of a security to recover the cost prior
to the expected date of sale.