Travelers 2003 Annual Report Download - page 82
Download and view the complete annual report
Please find page 82 of the 2003 Travelers annual report below. You can navigate through the pages in the report by either clicking on the pages listed below, or by using the keyword search tool below to find specific information within the annual report.
80
SELECTED FINANCIAL DATA
At and for the year ended December 31, (1)
in millions, except per share amounts 2003 2002 2001 2000 1999
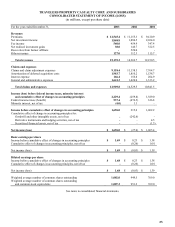
Total revenues $ 15,139.2 $ 14,269.7 $ 12,230.5 $ 11,071.0 $ 10,573.0
Income before cumulative effect of changes in
accounting principles $ 1,696.0 $ 215.6 $ 1,062.2 $ 1,312.2 $ 1,136.4
Cumulative effect of changes in accounting principles,
net of tax (2)
-
(242.6)
3.2
-
(112.1)
Net income (loss) $ 1,696.0 $ (27.0) $ 1,065.4 $ 1,312.2 $ 1,024.3
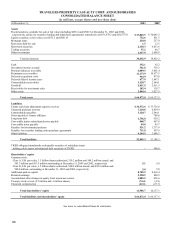
Total investments $ 38,652.9 $ 38,425.2 $ 32,618.6 $ 30,754.3 $ 29,842.6
Total assets 64,872.0 64,137.5 57,777.8 53,850.4 50,795.1
Claims and claim adjustment expense reserves 34,572.6 33,736.0 30,736.6 28,442.4 29,002.9
Total debt 2,674.5 2,543.7 2,077.5 3,005.3 2,147.8
Total liabilities(3) 52,885.3 53,100.2 46,191.5 43,736.4 43,455.5
TIGHI-obligated mandatorily redeemable securities of
subsidiary trusts holding solely junior subordinated
debt securities of TIGHI - 900.0 900.0 900.0 900.0
Shareholders’ equity 11,986.7 10,137.3 10,686.3 9,214.0 6,439.6
Basic earnings per share:
Income before cumulative effect of changes in
accounting principles $ 1.69 $ 0.23 $ 1.38 $ 1.71 $ 1.48
Cumulative effect of changes in accounting principles,
net of tax - (0.26) 0.01 - (0.15)
Reported net income (loss) 1.69 (0.03) 1.39 1.71 1.33
Goodwill amortization - - 0.09 0.08 0.06
Adjusted earnings (loss) per share $ 1.69 $ (0.03) $ 1.48 $ 1.79 $ 1.39
Diluted earnings per share:
Income before cumulative effect of changes in
accounting principles $ 1.68 $ 0.23 $ 1.38 $ 1.71 $ 1.48
Cumulative effect of changes in accounting
principles, net of tax - (0.26) 0.01 - (0.15)
Reported net income (loss) 1.68 (0.03) 1.39 1.71 1.33
Goodwill amortization - - 0.09 0.08 0.06
Adjusted earnings (loss) per share $ 1.68 $ (0.03) $ 1.48 $ 1.79 $ 1.39
Year-end common shares outstanding (4) 1,005.5 1,003.9 769.0 769.0 769.0
Per common share data:
Cash dividends(5) $ 0.28 $ 5.23 $ 0.53 $ - $ -
Book value $ 11.92 $ 10.10 $ 13.90 $ 11.98 $ 8.37


