Travelers 2003 Annual Report Download - page 114
Download and view the complete annual report
Please find page 114 of the 2003 Travelers annual report below. You can navigate through the pages in the report by either clicking on the pages listed below, or by using the keyword search tool below to find specific information within the annual report.-
 1
1 -
2
-
3
-
4
-
5
-
6
-
7
-
8
-
9
-
10
-
11
-
12
-
13
-
14
-
15
-
16
-
17
-
18
-
19
-
20
-
21
-
22
-
23
-
24
-
25
-
26
-
27
-
28
-
29
-
30
-
31
-
32
-
33
-
34
-
35
-
36
-
37
-
38
-
39
-
40
-
41
-
42
-
43
-
44
-
45
-
46
-
47
-
48
-
49
-
50
-
51
-
52
-
53
-
54
-
55
-
56
-
57
-
58
-
59
-
60
-
61
-
62
-
63
-
64
-
65
-
66
-
67
-
68
-
69
-
70
-
71
-
72
-
73
-
74
-
75
-
76
-
77
-
78
-
79
-
80
-
81
-
82
-
83
-
84
-
85
-
86
-
87
-
88
-
89
-
90
-
91
-
92
-
93
-
94
-
95
-
96
-
97
-
98
-
99
-
100
-
101
-
102
-
103
-
 104
104 -
 105
105 -
 106
106 -
 107
107 -
 108
108 -
 109
109 -
 110
110 -
 111
111 -
 112
112 -
 113
113 -
 114
114 -
 115
115 -
 116
116 -
 117
117 -
 118
118 -
 119
119 -
 120
120 -
 121
121 -
 122
122 -
 123
123 -
 124
124 -
125
-
126
-
127
-
128
-
129
-
130
-
131
-
132
-
133
-
134
-
135
-
136
-
137
-
138
-
139
-
140
-
141
-
142
-
143
-
144
-
145
-
146
-
147
-
148
-
149
-
150
-
151
-
152
-
153
-
154
-
155
-
156
 |
 |

112
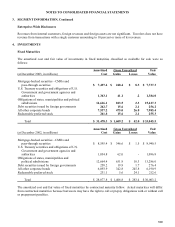
NOTES TO CONSOLIDATED FINANCIAL STATEMENTS
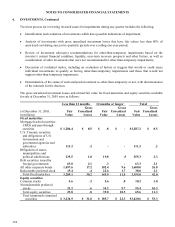
4. INVESTMENTS, Continued
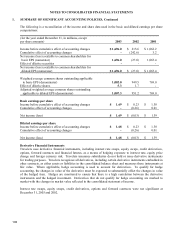
Travelers process for reviewing invested assets for impairments during any quarter includes the following:
• Identification and evaluation of investments which have possible indications of impairment;
• Analysis of investments with gross unrealized investment losses that have fair values less than 80% of
amortized cost during successive quarterly periods over a rolling one-year period;
• Review of investment advisor(s) recommendations for other-than-temporary impairments based on the
investee’s current financial condition, liquidity, near-term recovery prospects and other factors, as well as
consideration of other investments that were not recommended for other-than-temporary impairments;
• Discussion of evidential matter, including an evaluation of factors or triggers that would or could cause
individual investments to qualify as having other-than-temporary impairments and those that would not
support other-than-temporary impairment;
• Determination of the status of each analyzed investment as other-than-temporary or not, with documentation
of the rationale for the decision.
The gross unrealized investment losses and related fair value for fixed maturities and equity securities available
for sale at December 31, 2003 were as follows:
Less than 12 months 12 months or longer Total
Gross Gross Gross
(
at December 31, 2003, Fair Unrealized Fair Unrealized Fair Unrealized
in millions
)
Value Losses Value Losses Value Losses
Fixed maturities
Mort
g
a
g
e-
b
acked securities-
CMOs and
p
ass-throu
g
h
securities $ 1,286.4 $ 8.5 $ .8 $ - $ 1,287.2 $ 8.5
U.S. Treasur
y
securities
and obli
g
ations of U.S.
Government and
g
overnment a
g
encies and
authorities 111.2 .2 - - 111.2 .2
Obli
g
ations of states,
munici
p
alities and
p
olitical subdivisions 235.5 1.8 19.8 .5 255.3 2.3
Debt securities issued b
y
forei
g
n
g
overnments 63.0 2.1 .3 - 63.3 2.1
All other cor
p
orate bonds 1,497.6 17.2 102.4 9.6 1,600.0 26.8
Redeemable
p
referred stock 15.4 .4 22.6 1.7 38.0 2.1
Total fixed maturities 3
,
209.1 30.2 145.9 11.8 3
,
355.0 42.0
E
q
uit
y
securities
Common stocks 4.6 .2 5.6 .8 10.2 1.0
Nonredeemable
p
referred
stocks 21.2 .6 34.2 9.7 55.4 10.3
Total e
q
uit
y
securities 25.8 .8 39.8 10.5 65.6 11.3
Total tem
p
oraril
y
im
p
aired
securities $ 3,234.9 $ 31.0 $ 185.7 $ 22.3 $ 3,420.6 $ 53.3