Travelers 2003 Annual Report Download - page 111
Download and view the complete annual report
Please find page 111 of the 2003 Travelers annual report below. You can navigate through the pages in the report by either clicking on the pages listed below, or by using the keyword search tool below to find specific information within the annual report.-
 1
1 -
2
-
3
-
4
-
5
-
6
-
7
-
8
-
9
-
10
-
11
-
12
-
13
-
14
-
15
-
16
-
17
-
18
-
19
-
20
-
21
-
22
-
23
-
24
-
25
-
26
-
27
-
28
-
29
-
30
-
31
-
32
-
33
-
34
-
35
-
36
-
37
-
38
-
39
-
40
-
41
-
42
-
43
-
44
-
45
-
46
-
47
-
48
-
49
-
50
-
51
-
52
-
53
-
54
-
55
-
56
-
57
-
58
-
59
-
60
-
61
-
62
-
63
-
64
-
65
-
66
-
67
-
68
-
69
-
70
-
71
-
72
-
73
-
74
-
75
-
76
-
77
-
78
-
79
-
80
-
81
-
82
-
83
-
84
-
85
-
86
-
87
-
88
-
89
-
90
-
91
-
92
-
93
-
94
-
95
-
96
-
97
-
98
-
99
-
100
-
 101
101 -
 102
102 -
 103
103 -
 104
104 -
 105
105 -
 106
106 -
 107
107 -
 108
108 -
 109
109 -
 110
110 -
 111
111 -
 112
112 -
 113
113 -
 114
114 -
 115
115 -
 116
116 -
 117
117 -
 118
118 -
 119
119 -
 120
120 -
 121
121 -
122
-
123
-
124
-
125
-
126
-
127
-
128
-
129
-
130
-
131
-
132
-
133
-
134
-
135
-
136
-
137
-
138
-
139
-
140
-
141
-
142
-
143
-
144
-
145
-
146
-
147
-
148
-
149
-
150
-
151
-
152
-
153
-
154
-
155
-
156
 |
 |

109
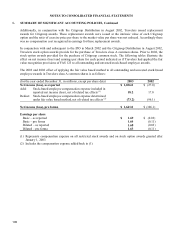
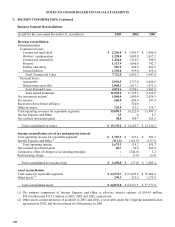
NOTES TO CONSOLIDATED FINANCIAL STATEMENTS
3. SEGMENT INFORMATION, Continued
Enterprise-Wide Disclosures
Revenues from internal customers, foreign revenues and foreign assets are not significant. Travelers does not have
revenue from transactions with a single customer amounting to 10 percent or more of its revenues.
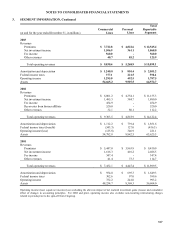
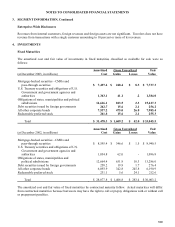
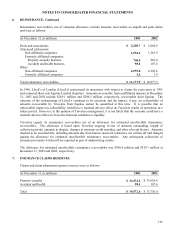
4. INVESTMENTS
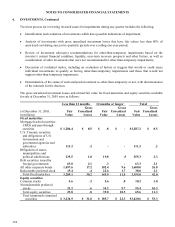
Fixed Maturities
The amortized cost and fair value of investments in fixed maturities classified as available for sale were as
follows:
Gross Unrealized
(at December 2003, in millions)
Amortized
Cost Gains Losses
Fair
Value
Mortgage-backed securities - CMOs and
pass-through securities $ 7,497.4 $ 248.4 $ 8.5 $ 7,737.3
U.S. Treasury securities and obligations of U.S.
Government and government agencies and
authorities 1,343.1
41.1
.2
1,384.0
Obligations of states, municipalities and political
subdivisions 14,616.1
813.5
2.3
15,427.3
Debt securities issued by foreign governments 242.7 15.6 2.1 256.2
All other corporate bonds 7,537.2 475.0 26.8 7,985.4
Redeemable preferred stock 241.8 15.6 2.1 255.3
Total $ 31,478.3 $ 1,609.2 $ 42.0 $ 33,045.5
Gross Unrealized
(at December 2002, in millions)
Amortized
Cost Gains Losses
Fair
Value
Mortgage-backed securities - CMOs and
pass-through securities $ 8,595.4 $ 346.6 $ 1.5 $ 8,940.5
U.S. Treasury securities and obligations of U.S.
Government and government agencies and
authorities
1,034.8
62.0
-
1,096.8
Obligations of states, municipalities and
political subdivisions
12,664.4
631.9
10.3
13,286.0
Debt securities issued by foreign governments 258.2 19.9 1.7 276.4
All other corporate bonds 6,093.9 342.8 245.8 6,190.9
Redeemable preferred stock 231.1 5.6 24.1 212.6
Total $ 28,877.8 $ 1,408.8 $ 283.4 $ 30,003.2
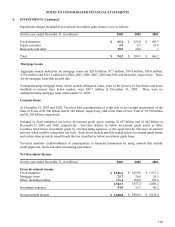
The amortized cost and fair value of fixed maturities by contractual maturity follow. Actual maturities will differ
from contractual maturities because borrowers may have the right to call or prepay obligations with or without call
or prepayment penalties.