Travelers 2003 Annual Report Download - page 110
Download and view the complete annual report
Please find page 110 of the 2003 Travelers annual report below. You can navigate through the pages in the report by either clicking on the pages listed below, or by using the keyword search tool below to find specific information within the annual report.-
 1
1 -
2
-
3
-
4
-
5
-
6
-
7
-
8
-
9
-
10
-
11
-
12
-
13
-
14
-
15
-
16
-
17
-
18
-
19
-
20
-
21
-
22
-
23
-
24
-
25
-
26
-
27
-
28
-
29
-
30
-
31
-
32
-
33
-
34
-
35
-
36
-
37
-
38
-
39
-
40
-
41
-
42
-
43
-
44
-
45
-
46
-
47
-
48
-
49
-
50
-
51
-
52
-
53
-
54
-
55
-
56
-
57
-
58
-
59
-
60
-
61
-
62
-
63
-
64
-
65
-
66
-
67
-
68
-
69
-
70
-
71
-
72
-
73
-
74
-
75
-
76
-
77
-
78
-
79
-
80
-
81
-
82
-
83
-
84
-
85
-
86
-
87
-
88
-
89
-
90
-
91
-
92
-
93
-
94
-
95
-
96
-
97
-
98
-
99
-
 100
100 -
 101
101 -
 102
102 -
 103
103 -
 104
104 -
 105
105 -
 106
106 -
 107
107 -
 108
108 -
 109
109 -
 110
110 -
 111
111 -
 112
112 -
 113
113 -
 114
114 -
 115
115 -
 116
116 -
 117
117 -
 118
118 -
 119
119 -
 120
120 -
121
-
122
-
123
-
124
-
125
-
126
-
127
-
128
-
129
-
130
-
131
-
132
-
133
-
134
-
135
-
136
-
137
-
138
-
139
-
140
-
141
-
142
-
143
-
144
-
145
-
146
-
147
-
148
-
149
-
150
-
151
-
152
-
153
-
154
-
155
-
156
 |
 |

108
NOTES TO CONSOLIDATED FINANCIAL STATEMENTS
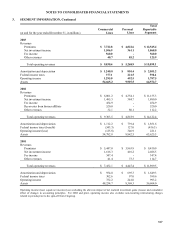
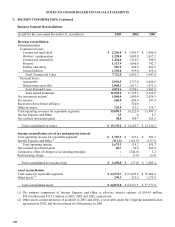
3. SEGMENT INFORMATION, Continued
Business Segment Reconciliations
(at and for the year ended December 31, in millions) 2003 2002 2001
Revenue reconciliation
Earned premiums
Commercial Lines:
Commercial multi-peril $ 2,256.8 $ 1,956.7 $ 1,686.4
Workers’ compensation 1,238.0 1,009.8 1,017.1
Commercial automobile 1,424.6 1,310.3 920.9
Property 1,113.9 1,066.6 742.7
Fidelity and surety 587.9 498.8 466.5
General liability 1,101.6 959.0 613.4
Total Commercial Lines 7,722.8 6,801.2 5,447.0
Personal Lines:
Automobile 2,954.5 2,737.0 2,490.6
Homeowners and other 1,868.1 1,617.1 1,473.3
Total Personal Lines 4,822.6 4,354.1 3,963.9
Total earned premiums 12,545.4 11,155.3 9,410.9
Net investment income 1,868.0 1,880.0 2,026.5
Fee income 560.0 454.9 347.4
Recoveries from former affiliates - 520.0 -
Other revenues 125.9 112.2 114.7
Total operating revenues for reportable segments 15,099.3 14,122.4 11,899.5
Interest Expense and Other 1.9 .6 8.5
Net realized investment gains 38.0 146.7 322.5
Total consolidated revenues $ 15,139.2 $ 14,269.7 $ 12,230.5
Income reconciliation, net of tax and minority interest
Total operating income for reportable segments $ 1,787.5 $ 221.1 $ 993.2
Interest Expense and Other (1) (112.2) (102.9) (137.5)
Total operating income 1,675.3 118.2 855.7
Net realized investment gains 20.7 99.0 209.9
Cumulative effect of changes in accounting principles - (242.6) 3.2
Restructuring charge - (1.6) (3.4)
Total consolidated net income (loss) $ 1,696.0 $ (27.0) $ 1,065.4
Asset reconciliation
Total assets for reportable segments $ 64,572.7 $ 63,625.3 $ 56,604.0
Other assets (2) 299.3 512.2 1,173.8
Total consolidated assets $ 64,872.0 $ 64,137.5 $ 57,777.8
(1) The primary component of Interest Expense and Other is after-tax interest expense of $104.9 million,
$99.6 million and $133.2 million in 2003, 2002 and 2001, respectively.
(2) Other assets consist primarily of goodwill in 2003 and 2002, a receivable under the Citigroup indemnification
agreement in 2002, and the investment in CitiInsurance in 2001.