Travelers 2003 Annual Report Download - page 109
Download and view the complete annual report
Please find page 109 of the 2003 Travelers annual report below. You can navigate through the pages in the report by either clicking on the pages listed below, or by using the keyword search tool below to find specific information within the annual report.-
 1
1 -
2
-
3
-
4
-
5
-
6
-
7
-
8
-
9
-
10
-
11
-
12
-
13
-
14
-
15
-
16
-
17
-
18
-
19
-
20
-
21
-
22
-
23
-
24
-
25
-
26
-
27
-
28
-
29
-
30
-
31
-
32
-
33
-
34
-
35
-
36
-
37
-
38
-
39
-
40
-
41
-
42
-
43
-
44
-
45
-
46
-
47
-
48
-
49
-
50
-
51
-
52
-
53
-
54
-
55
-
56
-
57
-
58
-
59
-
60
-
61
-
62
-
63
-
64
-
65
-
66
-
67
-
68
-
69
-
70
-
71
-
72
-
73
-
74
-
75
-
76
-
77
-
78
-
79
-
80
-
81
-
82
-
83
-
84
-
85
-
86
-
87
-
88
-
89
-
90
-
91
-
92
-
93
-
94
-
95
-
96
-
97
-
98
-
 99
99 -
 100
100 -
 101
101 -
 102
102 -
 103
103 -
 104
104 -
 105
105 -
 106
106 -
 107
107 -
 108
108 -
 109
109 -
 110
110 -
 111
111 -
 112
112 -
 113
113 -
 114
114 -
 115
115 -
 116
116 -
 117
117 -
 118
118 -
 119
119 -
120
-
121
-
122
-
123
-
124
-
125
-
126
-
127
-
128
-
129
-
130
-
131
-
132
-
133
-
134
-
135
-
136
-
137
-
138
-
139
-
140
-
141
-
142
-
143
-
144
-
145
-
146
-
147
-
148
-
149
-
150
-
151
-
152
-
153
-
154
-
155
-
156
 |
 |

107
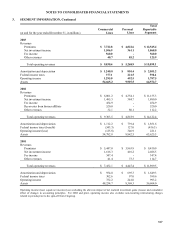
NOTES TO CONSOLIDATED FINANCIAL STATEMENTS
3. SEGMENT INFORMATION, Continued
Commercial
(at and for the year ended December 31, in millions) Lines
Personal
Lines
Total
Reportable
Segments
2003
Revenues
Premiums $ 7,722.8 $ 4,822.6 $ 12,545.4
Net investment income 1,506.9 361.1 1,868.0
Fee income 560.0 - 560.0
Other revenues 40.7 85.2 125.9
Total operating revenues $ 9,830.4 $ 5,268.9 $ 15,099.3
Amortization and depreciation $ 1,240.8 $ 810.4 $ 2,051.2
Federal income taxes 377.1 221.5 598.6
Operating income 1,295.0 492.5 1,787.5
Assets 54,665.2 9,907.5 64,572.7
2002
Revenues
Premiums $ 6,801.2 $ 4,354.1 $ 11,155.3
Net investment income 1,495.3 384.7 1,880.0
Fee income 454.9 - 454.9
Recoveries from former affiliate 520.0 - 520.0
Other revenues 32.1 80.1 112.2
Total operating revenues $ 9,303.5 $ 4,818.9 $ 14,122.4
Amortization and depreciation $ 1,112.2 $ 739.4 $ 1,851.6
Federal income taxes (benefit) (543.3) 127.0 (416.3)
Operating income (loss) (125.8) 346.9 221.1
Assets 54,782.8 8,842.5 63,625.3
2001
Revenues
Premiums $ 5,447.0 $ 3,963.9 $ 9,410.9
Net investment income 1,616.3 410.2 2,026.5
Fee income 347.4 - 347.4
Other revenues 41.4 73.3 114.7
Total operating revenues $ 7,452.1 $ 4,447.4 $ 11,899.5
Amortization and depreciation $ 954.0 $ 695.3 $ 1,649.3
Federal income taxes 302.6 97.0 399.6
Operating income 752.2 241.0 993.2
Assets 48,234.7 8,369.3 56,604.0
Operating income (loss) equals net income (loss) excluding the after-tax impact of net realized investment gains (losses) and cumulative
effect of changes in accounting principles. For 2002 and prior, operating income also excludes non-recurring restructuring charges
related to periods prior to the spin-off from Citigroup.