Travelers 2003 Annual Report Download - page 50
Download and view the complete annual report
Please find page 50 of the 2003 Travelers annual report below. You can navigate through the pages in the report by either clicking on the pages listed below, or by using the keyword search tool below to find specific information within the annual report.-
 1
1 -
2
-
3
-
4
-
5
-
6
-
7
-
8
-
9
-
10
-
11
-
12
-
13
-
14
-
15
-
16
-
17
-
18
-
19
-
20
-
21
-
22
-
23
-
24
-
25
-
26
-
27
-
28
-
29
-
30
-
31
-
32
-
33
-
34
-
35
-
36
-
37
-
38
-
39
-
 40
40 -
 41
41 -
 42
42 -
 43
43 -
 44
44 -
 45
45 -
 46
46 -
 47
47 -
 48
48 -
 49
49 -
 50
50 -
 51
51 -
 52
52 -
 53
53 -
 54
54 -
 55
55 -
 56
56 -
 57
57 -
 58
58 -
 59
59 -
 60
60 -
61
-
62
-
63
-
64
-
65
-
66
-
67
-
68
-
69
-
70
-
71
-
72
-
73
-
74
-
75
-
76
-
77
-
78
-
79
-
80
-
81
-
82
-
83
-
84
-
85
-
86
-
87
-
88
-
89
-
90
-
91
-
92
-
93
-
94
-
95
-
96
-
97
-
98
-
99
-
100
-
101
-
102
-
103
-
104
-
105
-
106
-
107
-
108
-
109
-
110
-
111
-
112
-
113
-
114
-
115
-
116
-
117
-
118
-
119
-
120
-
121
-
122
-
123
-
124
-
125
-
126
-
127
-
128
-
129
-
130
-
131
-
132
-
133
-
134
-
135
-
136
-
137
-
138
-
139
-
140
-
141
-
142
-
143
-
144
-
145
-
146
-
147
-
148
-
149
-
150
-
151
-
152
-
153
-
154
-
155
-
156
 |
 |

48
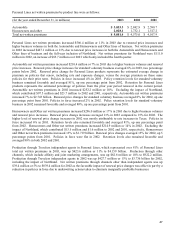
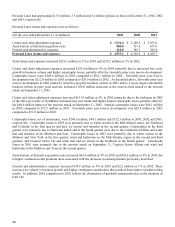
Personal Lines had approximately 5.8 million, 5.5 million and 5.4 million policies in force at December 31, 2003, 2002
and 2001, respectively.
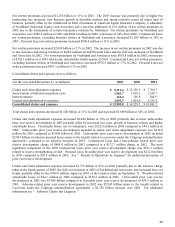
Personal Lines claims and expenses were as follows:
(for the year ended December 31, in millions) 2003 2002 2001
Claims and claim ad
j
ustment ex
p
enses $ 3,334.4 $ 3,206.4 $ 3,053.0
Amortization of deferred ac
q
uisition costs 800.8 737.4 673.8
General and administrative ex
p
enses 420.0 385.1 382.9
Personal Lines claims and expenses $ 4,555.2 $ 4,328.9 $ 4,109.7
Total claims and expenses increased $226.3 million or 5% in 2003 and $219.2 million or 5% in 2002.
Claims and claim adjustment expenses increased $128.0 million or 4% in 2003 primarily due to increased loss costs,
growth in business volume and higher catastrophe losses, partially offset by favorable prior year reserve development.
Catastrophe losses were $248.6 million in 2003 compared to $84.1 million in 2002. Favorable prior year reserve
development was $212.0 million in 2003 compared to $29.9 million in 2002. As discussed above, favorable prior year
reserve development in 2003 primarily related to property business written in 2002 and to a lesser degree automobile
business written in prior years and also included a $50.0 million reduction in the reserves held related to the terrorist
attack on September 11, 2001.
Claims and claim adjustment expenses increased $153.4 million or 5% in 2002 primarily due to the inclusion in 2002
of the full-year results of Northland, increased loss cost trends and higher natural catastrophe losses partially offset by
the $60.0 million impact of the terrorist attack on September 11, 2001. Natural catastrophe losses were $84.1 million
in 2002 compared to $72.5 million in 2001. Favorable prior year reserve development was $29.9 million in 2002
compared to $31.0 million in 2001.
Catastrophe losses, net of reinsurance, were $248.6 million, $84.1 million and $132.5 million in 2003, 2002 and 2001,
respectively. Catastrophe losses in 2003 were primarily due to winter storms in the Mid-Atlantic states, the Northeast
and Colorado in the first quarter and hail, ice storms and tornados in the second quarter. Catastrophes in the third
quarter were primarily due to Hurricane Isabel and in the fourth quarter were due to the California wildfires and wind,
hail and tornados in the Midwest and East. Catastrophe losses in 2002 were primarily due to winter storms in the
Midwest and New York in the first quarter, wind and hailstorms in the Mid-Atlantic region in the second and third
quarters, and Tropical Storm Lili and wind, hail and ice storms in the Southeast in the fourth quarter. Catastrophe
losses in 2001 were primarily due to the terrorist attack on September 11, Tropical Storm Allison and wind and
hailstorms in the Midwest and Texas in the second quarter.
Amortization of deferred acquisition costs increased $63.4 million or 9% in 2003 and $63.6 million or 9% in 2002 due
to higher commission and premium taxes associated with the increases in earned premium previously described.
General and administrative expenses increased $34.9 million or 9% in 2003 and $2.2 million or 1% in 2002. These
increases are related to business growth and higher contingent commissions that resulted from improved underwriting
results. In addition, 2002 comparison to 2001 reflects the elimination of goodwill amortization due to the adoption of
FAS 142.