Travelers 2003 Annual Report Download - page 40
Download and view the complete annual report
Please find page 40 of the 2003 Travelers annual report below. You can navigate through the pages in the report by either clicking on the pages listed below, or by using the keyword search tool below to find specific information within the annual report.-
 1
1 -
2
-
3
-
4
-
5
-
6
-
7
-
8
-
9
-
10
-
11
-
12
-
13
-
14
-
15
-
16
-
17
-
18
-
19
-
20
-
21
-
22
-
23
-
24
-
25
-
26
-
27
-
28
-
29
-
 30
30 -
 31
31 -
 32
32 -
 33
33 -
 34
34 -
 35
35 -
 36
36 -
 37
37 -
 38
38 -
 39
39 -
 40
40 -
 41
41 -
 42
42 -
 43
43 -
 44
44 -
 45
45 -
 46
46 -
 47
47 -
 48
48 -
 49
49 -
 50
50 -
51
-
52
-
53
-
54
-
55
-
56
-
57
-
58
-
59
-
60
-
61
-
62
-
63
-
64
-
65
-
66
-
67
-
68
-
69
-
70
-
71
-
72
-
73
-
74
-
75
-
76
-
77
-
78
-
79
-
80
-
81
-
82
-
83
-
84
-
85
-
86
-
87
-
88
-
89
-
90
-
91
-
92
-
93
-
94
-
95
-
96
-
97
-
98
-
99
-
100
-
101
-
102
-
103
-
104
-
105
-
106
-
107
-
108
-
109
-
110
-
111
-
112
-
113
-
114
-
115
-
116
-
117
-
118
-
119
-
120
-
121
-
122
-
123
-
124
-
125
-
126
-
127
-
128
-
129
-
130
-
131
-
132
-
133
-
134
-
135
-
136
-
137
-
138
-
139
-
140
-
141
-
142
-
143
-
144
-
145
-
146
-
147
-
148
-
149
-
150
-
151
-
152
-
153
-
154
-
155
-
156
 |
 |

38
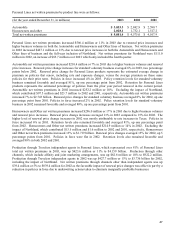
Revenues increased $869.5 million or 6% in 2003 and $2.039 billion or 17% in 2002.
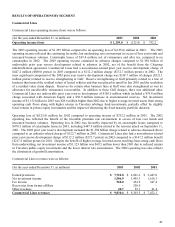
Earned premiums increased $1.390 billion or 12% in 2003 due to rate increases on renewal business, growth in
targeted new business and strong customer retention in both Commercial and Personal Lines. Commercial Lines
earned premiums increased $921.6 million or 14% in 2003, despite a planned reduction of business volume at
Northland and Associates. Personal Lines earned premiums increased $468.5 million or 11% in 2003. In 2002,
earned premiums increased $1.744 billion or 19% over 2001 due to rate increases on renewal business in both
Commercial and Personal Lines and the full-year inclusion of Northland and Associates in 2002.
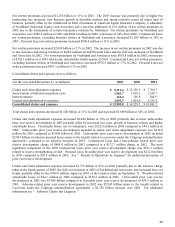
Net investment income decreased $11.7 million or less than 1% in 2003, despite higher average invested assets
resulting from strong cash flows from operations. The decline resulted from a reduction in investment yields to 5.3% in
2003 from 6.0% in 2002. The decrease in yields reflected the lower interest rate environment, the shortening of the
average effective duration of the fixed maturity portfolio, a higher proportion of tax exempt investments and reduced
returns in Travelers private equity investments, partially offset by higher returns in arbitrage fund investments. Pretax
net investment income decreased $153.5 million or 8% in 2002. The decline resulted from a reduction in investment
yields to 6.0% in 2002 from 6.9% in 2001. The decrease in yields reflected reduced returns in Travelers public equity
investments and the lower interest rate environment. The impact of lower yields was partially offset by the rise in
average invested assets due to the Northland and Associates acquisitions and increased cash flow from operations. Net
investment income related to Northland and Associates was $91.5 million in 2002, an increase of $68.4 million over
2001 which only included the fourth quarter.
Fee income increased $105.1 million or 23% in 2003 and $107.5 million or 31% in 2002. Fees rose as both new
business and pricing levels in Travelers National Accounts business increased and more workers’ compensation
business was written by state residual market pools that are serviced by National Accounts.
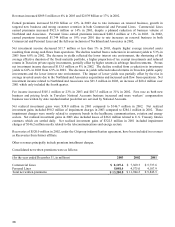
Net realized investment gains were $38.0 million in 2003 compared to $146.7 million in 2002. Net realized
investment gains included $90.2 million of impairment charges in 2003 compared to $284.1 million in 2002. These
impairment charges were mostly related to corporate bonds in the healthcare, communications, aviation and energy
sectors. Net realized investment gains in 2003 also included losses of $26.6 million related to U.S. Treasury futures
contracts which are settled daily. Net realized investment gains of $322.5 million in 2001 included impairment
charges of $146.2 million mostly related to the telecommunications and energy sectors.
Recoveries of $520.0 million in 2002, under the Citigroup indemnification agreement, have been included in revenues
as Recoveries from former affiliate.
Other revenues principally include premium installment charges.
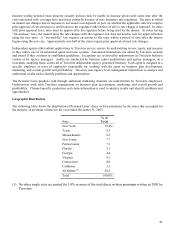
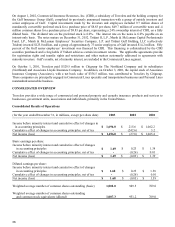
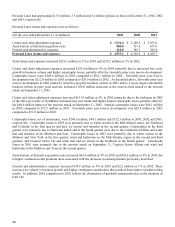
Consolidated net written premiums were as follows:
(for the year ended December 31, in millions) 2003 2002 2001
Commercial Lines $ 8,119.4 $ 7,369.5 $ 5,737.6
Personal Lines 5,081.4 4,575.0 4,107.9
Total net written premiums $ 13,200.8 $ 11,944.5 $ 9,845.5