Travelers 2003 Annual Report Download - page 42
Download and view the complete annual report
Please find page 42 of the 2003 Travelers annual report below. You can navigate through the pages in the report by either clicking on the pages listed below, or by using the keyword search tool below to find specific information within the annual report.-
 1
1 -
2
-
3
-
4
-
5
-
6
-
7
-
8
-
9
-
10
-
11
-
12
-
13
-
14
-
15
-
16
-
17
-
18
-
19
-
20
-
21
-
22
-
23
-
24
-
25
-
26
-
27
-
28
-
29
-
30
-
31
-
 32
32 -
 33
33 -
 34
34 -
 35
35 -
 36
36 -
 37
37 -
 38
38 -
 39
39 -
 40
40 -
 41
41 -
 42
42 -
 43
43 -
 44
44 -
 45
45 -
 46
46 -
 47
47 -
 48
48 -
 49
49 -
 50
50 -
 51
51 -
 52
52 -
53
-
54
-
55
-
56
-
57
-
58
-
59
-
60
-
61
-
62
-
63
-
64
-
65
-
66
-
67
-
68
-
69
-
70
-
71
-
72
-
73
-
74
-
75
-
76
-
77
-
78
-
79
-
80
-
81
-
82
-
83
-
84
-
85
-
86
-
87
-
88
-
89
-
90
-
91
-
92
-
93
-
94
-
95
-
96
-
97
-
98
-
99
-
100
-
101
-
102
-
103
-
104
-
105
-
106
-
107
-
108
-
109
-
110
-
111
-
112
-
113
-
114
-
115
-
116
-
117
-
118
-
119
-
120
-
121
-
122
-
123
-
124
-
125
-
126
-
127
-
128
-
129
-
130
-
131
-
132
-
133
-
134
-
135
-
136
-
137
-
138
-
139
-
140
-
141
-
142
-
143
-
144
-
145
-
146
-
147
-
148
-
149
-
150
-
151
-
152
-
153
-
154
-
155
-
156
 |
 |

40
Amortization of deferred acquisition costs increased $173.5 million or 10% in 2003 and $271.5 million or 18% in
2002. These increases reflect higher commission and premium taxes associated with the increases in earned premiums
previously described.
Interest expense increased $9.6 million or 6% in 2003 due to certain one time costs associated with the first and second
quarter refinancing activities that lowered average interest costs and higher levels of temporary debt. Interest expense
decreased $48.1 million or 23% in 2002 due to lower average interest-bearing debt levels primarily related to the
repayment of debt obligations to Citigroup in the 2002 first quarter.
General and administrative expenses increased $217.3 million or 15% in 2003 and $90.8 million or 7% in 2002.
These increases related to business growth and higher contingent commissions that resulted from improved
underwriting results. In addition, the 2002 comparison to 2001 reflects the elimination of goodwill amortization due to
the adoption of FAS 142.
Travelers effective tax rate was 24.1%, (183.4)% and 23.5% in 2003, 2002 and 2001, respectively. The 2003 increase
in the effective rate reflected a higher level of pretax income associated with improved underwriting performance
primarily related to the impact of the 2002 fourth quarter asbestos charge previously discussed and the impact of non-
taxable recoveries of $520.0 million related to the Citigroup indemnification agreement in 2002, partially offset by a
higher level of non-taxable investment income in 2003. The 2002 decrease in the effective rate reflected lower pretax
income and the impact of the non-taxable recoveries from Citigroup as discussed above, in addition to a higher level of
non-taxable net investment income in 2002 compared to 2001.
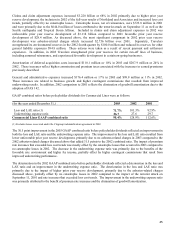
The GAAP combined ratios before policyholder dividends were as follows:
(for the year ended December 31,) 2003 2002 2001
Loss and loss ad
j
ustment ex
p
ense
(
LAE
)
ratio
(
1
)
70.7% 90.5% 80.4%
Underwritin
g
ex
p
ense ratio 26.2 26.9 28.5
Consolidated GAAP combined ratio 96.9% 117.4% 108.9%
(1) Excludes losses recovered under the Citigroup indemnification agreement in 2002.
The 20.5 point improvement in the 2003 GAAP combined ratio before policyholder dividends resulted from lower
unfavorable prior year reserve development, primarily due to having no asbestos charges in 2003 compared to asbestos
charges in 2002 that added 19.2 points. The benefit from premium rate increases that exceeded loss costs trends were
mostly offset by higher catastrophe losses.
The deterioration in the 2002 GAAP combined ratio before policyholder dividends resulted from the impact of higher
prior year reserve development that primarily resulted from the asbestos-related charges in 2002, partially offset by
lower catastrophe losses in 2002 compared to 2001 (which included the impact of the September 11, 2001 terrorist
attack), the elimination of goodwill amortization and rate increases that exceeded loss cost trends.