Reebok 2008 Annual Report Download - page 99
Download and view the complete annual report
Please find page 99 of the 2008 Reebok annual report below. You can navigate through the pages in the report by either clicking on the pages listed below, or by using the keyword search tool below to find specific information within the annual report.-
 1
1 -
2
-
3
-
4
-
5
-
6
-
7
-
8
-
9
-
10
-
11
-
12
-
13
-
14
-
15
-
16
-
17
-
18
-
19
-
20
-
21
-
22
-
23
-
24
-
25
-
26
-
27
-
28
-
29
-
30
-
31
-
32
-
33
-
34
-
35
-
36
-
37
-
38
-
39
-
40
-
41
-
42
-
43
-
44
-
45
-
46
-
47
-
48
-
49
-
50
-
51
-
52
-
53
-
54
-
55
-
56
-
57
-
58
-
59
-
60
-
61
-
62
-
63
-
64
-
65
-
66
-
67
-
68
-
69
-
70
-
71
-
72
-
73
-
74
-
75
-
76
-
77
-
78
-
79
-
80
-
81
-
82
-
83
-
84
-
85
-
86
-
87
-
88
-
 89
89 -
 90
90 -
 91
91 -
 92
92 -
 93
93 -
 94
94 -
 95
95 -
 96
96 -
 97
97 -
 98
98 -
 99
99 -
 100
100 -
 101
101 -
 102
102 -
 103
103 -
 104
104 -
 105
105 -
 106
106 -
 107
107 -
 108
108 -
 109
109 -
110
-
111
-
112
-
113
-
114
-
115
-
116
-
117
-
118
-
119
-
120
-
121
-
122
-
123
-
124
-
125
-
126
-
127
-
128
-
129
-
130
-
131
-
132
-
133
-
134
-
135
-
136
-
137
-
138
-
139
-
140
-
141
-
142
-
143
-
144
-
145
-
146
-
147
-
148
-
149
-
150
-
151
-
152
-
153
-
154
-
155
-
156
-
157
-
158
-
159
-
160
-
161
-
162
-
163
-
164
-
165
-
166
-
167
-
168
-
169
-
170
-
171
-
172
-
173
-
174
-
175
-
176
-
177
-
178
-
179
-
180
-
181
-
182
-
183
-
184
-
185
-
186
-
187
-
188
-
189
-
190
-
191
-
192
-
193
-
194
-
195
-
196
-
197
-
198
-
199
-
200
-
201
-
202
-
203
-
204
-
205
-
206
-
207
-
208
-
209
-
210
-
211
-
212
-
213
-
214
-
215
-
216
-
217
-
218
-
219
-
220
 |
 |
adidas Group Annual Report 2008 095
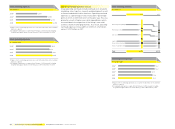
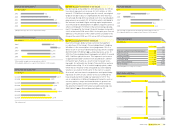
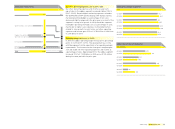
Financing structure
€ in millions
2008 2007
Total cash and short-term fi nancial assets 384 381
Bank borrowings 605 198
Commercial paper 143 0
Private placements 1,432 1,564
Convertible bond 393 384
Gross total borrowings 2,573 2,146
Net borrowings 1) 2,189 1,766
1) Rounding differences may arise in totals.
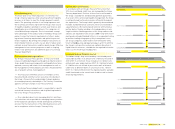
Interest rate development 1)
in % per annum
2004 3.4
2005 4.0
2006 4.8
2007 5.3
2008 5.2
1) Weighted average interest rate of gross borrowings.
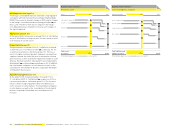
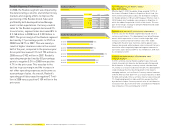
Net cash /(Net borrowings)
€ in millions
2004 1) (665)
2005 551
2006 2) (2,231)
2007 (1,766)
2008 (2,189)
1) Restated due to application of amendment to IAS 39.
2) Including Reebok business segment from February 1, 2006 onwards.
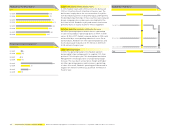
Financial leverage
in %
2004 1) 43.1
2005 (20.5)
2006 2) 78.9
2007 58.4
2008 64.6
1) Restated due to application of IAS 32 /IAS 39 and amendment to IAS 19.
2) Including Reebok business segment from February 1, 2006 onwards.
Net borrowings by quarter 1)
€ in millions
Q1 2007
Q1 2008
2,519
2,073
Q2 2007
Q2 2008
2,395
2,260
Q3 2007
Q3 2008
2,201
2,593
Q4 2007
Q4 2008
1,766
2,189
1) At end of period.
Net debt position increased by € 423 million
Net borrowings at December 31, 2008 amounted to € 2.189 bil-
lion, which represents an increase of € 423 million, or 24%,
versus € 1.766 billion in the prior year. As a result, our original
target of net debt to be at or slightly below the 2007 level was
not achieved. During 2008, we utilised cash for a share buyback
programme in an amount of € 409 million which contributed to
the increase in net debt. Higher working capital requirements
also infl uenced this development. In addition, negative currency
effects contributed € 93 million to the net borrowings develop-
ment. Consequently, the Group’s fi nancial leverage increased to
64.6% at the end of 2008 versus 58.4% in the prior year. On a net
debt basis, the utilisation of the credit facilities available to the
Group at the end of 2008 was 33% versus 28% in the prior year.
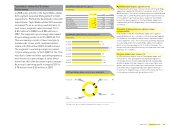
Currency management further optimised
Due to the Group’s global activity, currency management
is a key focus of the Group’s Treasury department. Hedging
US dollars is the central pillar of our programme. This is a
direct result of our Asian-dominated sourcing, which is largely
denominated in US dollars see Global Operations, p. 064. In
2008, the Treasury department managed a net defi cit of around
US $ 1.9 billion against the euro. This represents an increase
of approximately US $ 0.4 billion from around US $ 1.5 billion
in the prior year, mainly as a result of our increased sourc-
ing needs. As outlined in our Group’s Treasury Policy, we have
established a rolling 12- to 24-month hedging system, under
which the vast majority of the anticipated seasonal hedging
volume is secured six months prior to the start of a season.
As a result, we have almost completed our anticipated hedg-
ing needs for 2009 at rates similar to those of 2008 and we
have already started to hedge our exposure for 2010. The
use or combination of different hedging instruments, such as
currency options, swaps and forward contracts, protects us
against unfavourable currency movements, while retaining
the potential to benefi t from future favourable exchange rate
developments see Risk and Opportunity Report, p. 107.
Short-term credit lines
€ in millions
2008 2007
Total 2,722 2,314
Uncommitted 1,585
Committed 1,137
1,381
933