Reebok 2008 Annual Report Download - page 217
Download and view the complete annual report
Please find page 217 of the 2008 Reebok annual report below. You can navigate through the pages in the report by either clicking on the pages listed below, or by using the keyword search tool below to find specific information within the annual report.-
 1
1 -
2
-
3
-
4
-
5
-
6
-
7
-
8
-
9
-
10
-
11
-
12
-
13
-
14
-
15
-
16
-
17
-
18
-
19
-
20
-
21
-
22
-
23
-
24
-
25
-
26
-
27
-
28
-
29
-
30
-
31
-
32
-
33
-
34
-
35
-
36
-
37
-
38
-
39
-
40
-
41
-
42
-
43
-
44
-
45
-
46
-
47
-
48
-
49
-
50
-
51
-
52
-
53
-
54
-
55
-
56
-
57
-
58
-
59
-
60
-
61
-
62
-
63
-
64
-
65
-
66
-
67
-
68
-
69
-
70
-
71
-
72
-
73
-
74
-
75
-
76
-
77
-
78
-
79
-
80
-
81
-
82
-
83
-
84
-
85
-
86
-
87
-
88
-
89
-
90
-
91
-
92
-
93
-
94
-
95
-
96
-
97
-
98
-
99
-
100
-
101
-
102
-
103
-
104
-
105
-
106
-
107
-
108
-
109
-
110
-
111
-
112
-
113
-
114
-
115
-
116
-
117
-
118
-
119
-
120
-
121
-
122
-
123
-
124
-
125
-
126
-
127
-
128
-
129
-
130
-
131
-
132
-
133
-
134
-
135
-
136
-
137
-
138
-
139
-
140
-
141
-
142
-
143
-
144
-
145
-
146
-
147
-
148
-
149
-
150
-
151
-
152
-
153
-
154
-
155
-
156
-
157
-
158
-
159
-
160
-
161
-
162
-
163
-
164
-
165
-
166
-
167
-
168
-
169
-
170
-
171
-
172
-
173
-
174
-
175
-
176
-
177
-
178
-
179
-
180
-
181
-
182
-
183
-
184
-
185
-
186
-
187
-
188
-
189
-
190
-
191
-
192
-
193
-
194
-
195
-
196
-
197
-
198
-
199
-
200
-
201
-
202
-
203
-
204
-
205
-
206
-
 207
207 -
 208
208 -
 209
209 -
 210
210 -
 211
211 -
 212
212 -
 213
213 -
 214
214 -
 215
215 -
 216
216 -
 217
217 -
 218
218 -
 219
219 -
 220
220
 |
 |
adidas Group Annual Report 2008 213
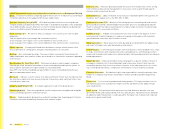
Segmental reporting Information regarding the fi nancial position and results of operations
in individual brands (segments) and regions. This gives an indication of developments in the
individual segments and their contribution to the Group’s results.
Sell-through An indicator of how fast retailers are selling a particular product to the
consumer.
Shareholder value A management concept that focuses strategic and operational decision-
making on steadily increasing a company’s value for shareholders.
Shop-in-shop adidas, Reebok or Rockport area within a larger store. The concept may be
operated by the store or the adidas Group depending on individual arrangements. The goal of
this distribution method is to give consumers a similar experience to an own-retail environment,
albeit on a smaller scale.
Signature collection Product collection which carries the name and /or visuals relating to a
top athlete.
Sourcing Process of managing external suppliers in order to commercialise, produce and
deliver fi nal products to customers.
Sporting goods channel Sports retail store, offering a very broad product range, which usually
covers apparel, footwear and hardware in a wide range of sports categories. Compared to sport
specialty shops, stores are bigger with approx. 40,000 to 50,000 square feet.
Sport specialty Retail shop, specialising in sports products only and offering a very deep
product range (often in a limited number of sports categories) rather than a broad one. The size
of these shops is typically about 2,500 to 10,000 square feet.
Stakeholders All parties that have a direct or indirect interest in a company’s performance
and results. For the adidas Group, this includes credit providers, shareholders, consumers,
retailers, distributors, licensees, supply chain business partners, employees, international
sports bodies, non-governmental organisations, the media, etc.
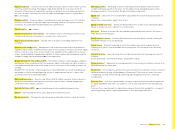
Supply chain Refers to the system and organisation from product sourcing through to end
customer delivery.
Swaps A derivative in which two counterparties agree to exchange one stream of cash fl ows
against another stream.
Synergies Additional savings or revenue growth when one combined enterprise is created
from two or more separate parts.
Tax rate Indicates the tax rate paid by a company. Calculated by dividing taxes by income
before taxes.
Top-down, bottom-up Specifi c concept for information and knowledge processing. Information
and empowerment of management decisions is delegated from top to bottom in a fi rst step.
After going into more detail on the bottom level, the fi nal information /decision is transported
back to the top.
VOC (Volatile Organic Compounds) Solvents that can cause breathing and health problems.
VOCs are by-products of the shoe manufacturing process. Due to health concerns, the adidas
Group has set a clear goal to steadily reduce the usage of these compounds in the production
process.
Weighted average cost of capital Calculation of the cost of capital according to the debt /equity
structure, utilising a weighted average cost of capital (WACC) formula. The cost of equity is typi-
cally computed utilising a risk-free rate, market risk premium and a beta factor. The cost of debt
is calculated through the risk-free rate, credit spread and average tax rate see also Beta Factor
and Market Risk Premium.
Working capital A company’s short-term disposable capital used to fi nance the day-to-day
operations.
Working capital = total current assets – total current liabilities.
see also Operating Working Capital
Working capital turnover Shows how often a working capital item was used in and replaced by
the generation of sales in the period under review. The ratio shows how long working capital is
tied up and thus is an indicator of the volume of capital needed to generate sales. The higher the
ratio, the more positive it is deemed to be.
Working capital turnover = net sales / working capital.