Reebok 2008 Annual Report Download - page 119
Download and view the complete annual report
Please find page 119 of the 2008 Reebok annual report below. You can navigate through the pages in the report by either clicking on the pages listed below, or by using the keyword search tool below to find specific information within the annual report.-
 1
1 -
2
-
3
-
4
-
5
-
6
-
7
-
8
-
9
-
10
-
11
-
12
-
13
-
14
-
15
-
16
-
17
-
18
-
19
-
20
-
21
-
22
-
23
-
24
-
25
-
26
-
27
-
28
-
29
-
30
-
31
-
32
-
33
-
34
-
35
-
36
-
37
-
38
-
39
-
40
-
41
-
42
-
43
-
44
-
45
-
46
-
47
-
48
-
49
-
50
-
51
-
52
-
53
-
54
-
55
-
56
-
57
-
58
-
59
-
60
-
61
-
62
-
63
-
64
-
65
-
66
-
67
-
68
-
69
-
70
-
71
-
72
-
73
-
74
-
75
-
76
-
77
-
78
-
79
-
80
-
81
-
82
-
83
-
84
-
85
-
86
-
87
-
88
-
89
-
90
-
91
-
92
-
93
-
94
-
95
-
96
-
97
-
98
-
99
-
100
-
101
-
102
-
103
-
104
-
105
-
106
-
107
-
108
-
 109
109 -
 110
110 -
 111
111 -
 112
112 -
 113
113 -
 114
114 -
 115
115 -
 116
116 -
 117
117 -
 118
118 -
 119
119 -
 120
120 -
 121
121 -
 122
122 -
 123
123 -
 124
124 -
 125
125 -
 126
126 -
 127
127 -
 128
128 -
 129
129 -
130
-
131
-
132
-
133
-
134
-
135
-
136
-
137
-
138
-
139
-
140
-
141
-
142
-
143
-
144
-
145
-
146
-
147
-
148
-
149
-
150
-
151
-
152
-
153
-
154
-
155
-
156
-
157
-
158
-
159
-
160
-
161
-
162
-
163
-
164
-
165
-
166
-
167
-
168
-
169
-
170
-
171
-
172
-
173
-
174
-
175
-
176
-
177
-
178
-
179
-
180
-
181
-
182
-
183
-
184
-
185
-
186
-
187
-
188
-
189
-
190
-
191
-
192
-
193
-
194
-
195
-
196
-
197
-
198
-
199
-
200
-
201
-
202
-
203
-
204
-
205
-
206
-
207
-
208
-
209
-
210
-
211
-
212
-
213
-
214
-
215
-
216
-
217
-
218
-
219
-
220
 |
 |

adidas Group Annual Report 2008 115
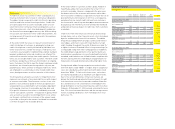
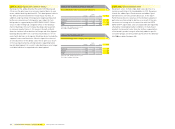
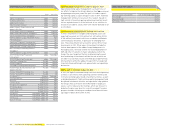
Exposure to foreign exchange risk 1)
based on notional amounts, € in millions
USD GBP JPY
As at December 31, 2008
Exposure from fi rm commitments
and forecasted transactions (2,341) 323 339
Balance sheet exposure including
intercompany exposure (192) (24) (7)
Total gross exposure (2,533) 299 332
Hedged with other cash fl ows 83 — —
Hedged with currency options 457 (25) (57)
Hedged with forward contracts 1,294 (197) (185)
Net exposure (699) 77 90
As at December 31, 2007
Exposure from fi rm commitments
and forecasted transactions (1,810) 372 249
Balance sheet exposure including
intercompany exposure (65) 15 9
Total gross exposure (1,875) 387 258
Hedged with other cash fl ows 136 0 0
Hedged with currency options 562 0 (142)
Hedged with forward contracts 1,124 (153) (107)
Net exposure (53) 234 9
1) Rounding differences may arise in totals.
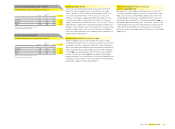
Sensitivity analysis of foreign exchange rate changes
€ in millions
USD GBP JPY
As at December 31, 2008
EUR +10% EUR +10% USD +10%
Equity (108) 17 22
Net income 10 (1) (1)
EUR – 10% EUR – 10% USD – 10%
Equity 133 (20) (21)
Net income (13) 0 1
As at December 31, 2007
EUR +10% EUR +10% USD +10%
Equity (111) 9 28
Net income 5 (1) (1)
EUR – 10% EUR – 10% USD – 10%
Equity 130 (11) (26)
Net income (6) 2 1
This leads to a maximum exposure of € 58 million in the event
of default of any single bank. Furthermore, we held derivatives
with a positive fair market value in the amount of € 213 mil-
lion. The maximum exposure to any single bank resulting from
these assets amounted to € 23 million and the average con-
centration was 4%.
Financing and liquidity risks
Liquidity risks arise from not having the necessary resources
available to meet maturing liabilities with regard to timing,
volume and currency structure. In addition, the adidas Group
faces the risk of having to accept unfavourable fi nancing terms
due to liquidity restraints. Our Group’s Treasury department
uses an effi cient cash management system to manage liquidity
risk. At December 31, 2008, Group cash and cash equivalents
amounted to € 244 million (2007: € 295 million). Moreover,
our Group maintains € 2.7 billion bilateral short-term credit
lines and a € 2 billion committed medium-term syndicated
loan facility with international banks, which does not include
a market disruption clause. The € 4.7 billion in credit lines
are designed to ensure suffi cient liquidity at all times see
Treasury, p. 093.
Future cash outfl ows arising from fi nancial liabilities that are
recognised in the Consolidated Balance Sheet are presented
within the adjacent table. This includes payments to settle
obligations from borrowings as well as cash outfl ows from
cash-settled derivatives with negative market values. Financial
liabilities that may be settled in advance without penalty are
included on the basis of the earliest date of potential repay-
ment. Cash fl ows for variable-interest liabilities are deter-
mined with reference to the conditions at the balance sheet
date.
Based on our available credit lines and business model, we
continue to regard the occurrence probability of fi nancing
and liquidity risks, which could also lead to increased interest
costs, as low. Nevertheless, failure to maintain liquidity could
have a high fi nancial impact on Group performance.
Currency risks
Currency risks for the adidas Group are a direct result of multi-
currency cash fl ows within the Group. The biggest single driver
behind this risk results from the mismatch of the currencies
required for sourcing our products versus the denominations
of our sales. The vast majority of our sourcing expenses are
in US dollars while sales are denominated in other currencies
to a large extent – most notably the euro. Our main exposures
are presented in the adjacent table. The exposure from fi rm
commitments and forecasted transactions was calculated on a
one-year basis. The 2007 fi gures have been restated to provide
consistency of presentation.
In line with IFRS 7 requirements, we have estimated the impact
on net income and shareholders’ equity based on changes in
our most important currency exchange rates. The calculated
impacts mainly result from fair value changes of our hedging
instruments. The analysis does not include effects that arise
from the translation of our foreign entities’ fi nancial state-
ments into the Group’s reporting currency. The sensitivity
analysis is based on the net balance sheet exposure, including
intercompany balances from monetary assets and liabilities
denominated in foreign currencies. Moreover, all currency
derivatives were re-evaluated using hypothetical foreign
exchange rates to determine the effects on net income and
equity. The analysis was performed on the same basis for both
2007 and 2008.
Based on this analysis, a 10% increase in the euro versus the
US dollar at December 31, 2008, would have led to a € 10 mil-
lion increase in net income. The more negative market values
of the US dollar hedges would have decreased shareholders’
equity by € 108 million. A 10% weaker euro at December 31,
2008 would have led to a € 13 million decrease in net income.
Shareholders’ equity would have increased by € 133 million.
The impacts of fl uctuations of the euro against the British
pound and of the US dollar against the Japanese yen on net
income and shareholders’ equity are also included in accord-
ance with IFRS requirements.
However, many other fi nancial and operational variables that
could potentially reduce the effect of currency fl uctuations are
excluded from the analysis. These include:
—
Interest rates and all other exchange rates are assumed
constant.