Reebok 2008 Annual Report Download - page 98
Download and view the complete annual report
Please find page 98 of the 2008 Reebok annual report below. You can navigate through the pages in the report by either clicking on the pages listed below, or by using the keyword search tool below to find specific information within the annual report.-
 1
1 -
2
-
3
-
4
-
5
-
6
-
7
-
8
-
9
-
10
-
11
-
12
-
13
-
14
-
15
-
16
-
17
-
18
-
19
-
20
-
21
-
22
-
23
-
24
-
25
-
26
-
27
-
28
-
29
-
30
-
31
-
32
-
33
-
34
-
35
-
36
-
37
-
38
-
39
-
40
-
41
-
42
-
43
-
44
-
45
-
46
-
47
-
48
-
49
-
50
-
51
-
52
-
53
-
54
-
55
-
56
-
57
-
58
-
59
-
60
-
61
-
62
-
63
-
64
-
65
-
66
-
67
-
68
-
69
-
70
-
71
-
72
-
73
-
74
-
75
-
76
-
77
-
78
-
79
-
80
-
81
-
82
-
83
-
84
-
85
-
86
-
87
-
 88
88 -
 89
89 -
 90
90 -
 91
91 -
 92
92 -
 93
93 -
 94
94 -
 95
95 -
 96
96 -
 97
97 -
 98
98 -
 99
99 -
 100
100 -
 101
101 -
 102
102 -
 103
103 -
 104
104 -
 105
105 -
 106
106 -
 107
107 -
 108
108 -
109
-
110
-
111
-
112
-
113
-
114
-
115
-
116
-
117
-
118
-
119
-
120
-
121
-
122
-
123
-
124
-
125
-
126
-
127
-
128
-
129
-
130
-
131
-
132
-
133
-
134
-
135
-
136
-
137
-
138
-
139
-
140
-
141
-
142
-
143
-
144
-
145
-
146
-
147
-
148
-
149
-
150
-
151
-
152
-
153
-
154
-
155
-
156
-
157
-
158
-
159
-
160
-
161
-
162
-
163
-
164
-
165
-
166
-
167
-
168
-
169
-
170
-
171
-
172
-
173
-
174
-
175
-
176
-
177
-
178
-
179
-
180
-
181
-
182
-
183
-
184
-
185
-
186
-
187
-
188
-
189
-
190
-
191
-
192
-
193
-
194
-
195
-
196
-
197
-
198
-
199
-
200
-
201
-
202
-
203
-
204
-
205
-
206
-
207
-
208
-
209
-
210
-
211
-
212
-
213
-
214
-
215
-
216
-
217
-
218
-
219
-
220
 |
 |

094 Group Management Report – Our Financial Year Group Business Performance — Treasury
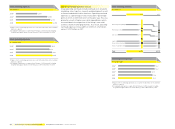
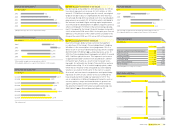
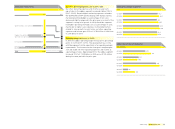
Currency split of gross borrowings
€ in millions
2008 2007
Total 2,573 2,146
All others 95
JPY 4
USD 1,004
EUR 1,470
90
5
959
1,092
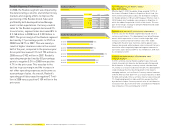
Issued bonds at a glance
in millions
Issued bonds Volume Coupon Maturity
Asian private placement USD 218 variable 2009
Asian private placement JPY 3,000 fi xed 2009
Asian private placement EUR 26 variable 2010
Asian private placement AUD 16 variable 2010
German private placement EUR 150 fi xed and
variable
2010
French private placement EUR 150 variable 2011 – 2012
US private placement USD 270 fi xed 2009
US private placement USD 288 fi xed 2011
US private placement USD 292 fi xed 2013
US private placement USD 175 fi xed 2015
US private placement USD 150 fi xed 2016
Convertible bond EUR 400 2.50% 2018
Other private placements EUR 73 fi xed and
variable
2009 – 2012
Short-term credit lines increase
Short-term credit lines increased 18% to € 2.722 billion at the
end of 2008 from € 2.314 billion in the prior year. The credit
lines in 2008 increased to promote liquidity fl exibility. Com-
mitted and uncommitted credit lines represent approximately
42% and 58% of total short-term credit lines, respectively.
Standard fi nancial covenants
Under our committed credit facilities we have entered into vari-
ous covenants. These covenants include limits on the disposal
of fi xed assets and the amount of debt secured by liens we may
incur. In addition, our fi nancial arrangements contain equity
ratio covenants, minimum equity covenants as well as net loss
covenants. If we fail to meet any covenant and are unable to
obtain a waiver from a majority of partner banks, borrowings
would become due and payable immediately. As at December
31, 2008, we were in full compliance with all of our covenants.
As a result of our cash fl ow expectations, we are confi dent
we will continue to be compliant with these covenants going
forward see Subsequent Events and Outlook, p. 120. We currently
believe that cash generated by operations, together with access
to external sources of funds, will be suffi cient to meet our
future operating and capital needs.
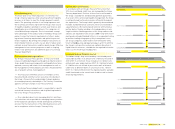
Gross borrowings increase
Gross borrowings increased 20% to € 2.573 billion at the end
of 2008 from € 2.146 billion in the prior year. Bank borrowings
increased 206% to € 605 million from € 198 million in the prior
year. Our private placements in the USA, in Europe and in Asia
decreased 9% to € 1.432 billion in 2008 (2007: € 1.564 bil-
lion). The current value of the convertible bond increased
2% to € 393 million in 2008 from € 384 million in the prior
year, refl ecting the accrued interest on the debt component
in accordance with IFRS requirements. Commercial paper
amounting to € 143 million was outstanding at the end of 2008
(2007: € 0).
Euro dominates currency mix
The majority of our Group’s gross borrowings are denominated
in euros and US dollars. Gross borrowings denominated in
euros accounted for 57% of total gross borrowings (2007: 51%).
The share of gross borrowings held in US dollars decreased to
39% (2007: 45%).
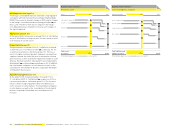
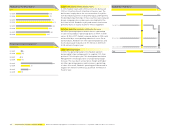
Interest rate slightly decreases
The weighted average interest rate on the Group’s gross
borrowings decreased slightly to 5.2% in 2008 (2007: 5.3%).
High interest rates, mainly in the Euro Zone, during the fi rst
half of the year were offset by decreased interest rates world-
wide in the second half of 2008. Long-term fi xed-rate fi nancing
amounted to around 60% of the Group’s total fi nancing at the
end of 2008 (2007: around 70%). Variable fi nancing amounted
to around 40% of total fi nancing at the end of the year (2007:
around 30%).